OpenTelemetry v2
OpenTelemetry v2 (OTel v2) is LiteLLM Proxy's next-generation tracing. It gives you one clean trace per request covering the incoming HTTP call, authentication, guardrails, the LLM call itself, and the internal database/cache work, all nested in a single tree.
It follows standard OpenTelemetry GenAI semantic conventions, so the traces it produces are readable in any OTel backend (Grafana Tempo, Jaeger, Honeycomb, Datadog, …) and come with ready-made presets for popular LLM observability tools (Arize, Phoenix, Langfuse, Weave, Langtrace, Levo, AgentOps, SigNoz).
OTel v2 is off by default. Nothing in it runs until you set LITELLM_OTEL_V2=true. It is separate from the existing OpenTelemetry integration, so pick one. If you are moving from v1, see Migrating to OpenTelemetry v2.
What you get
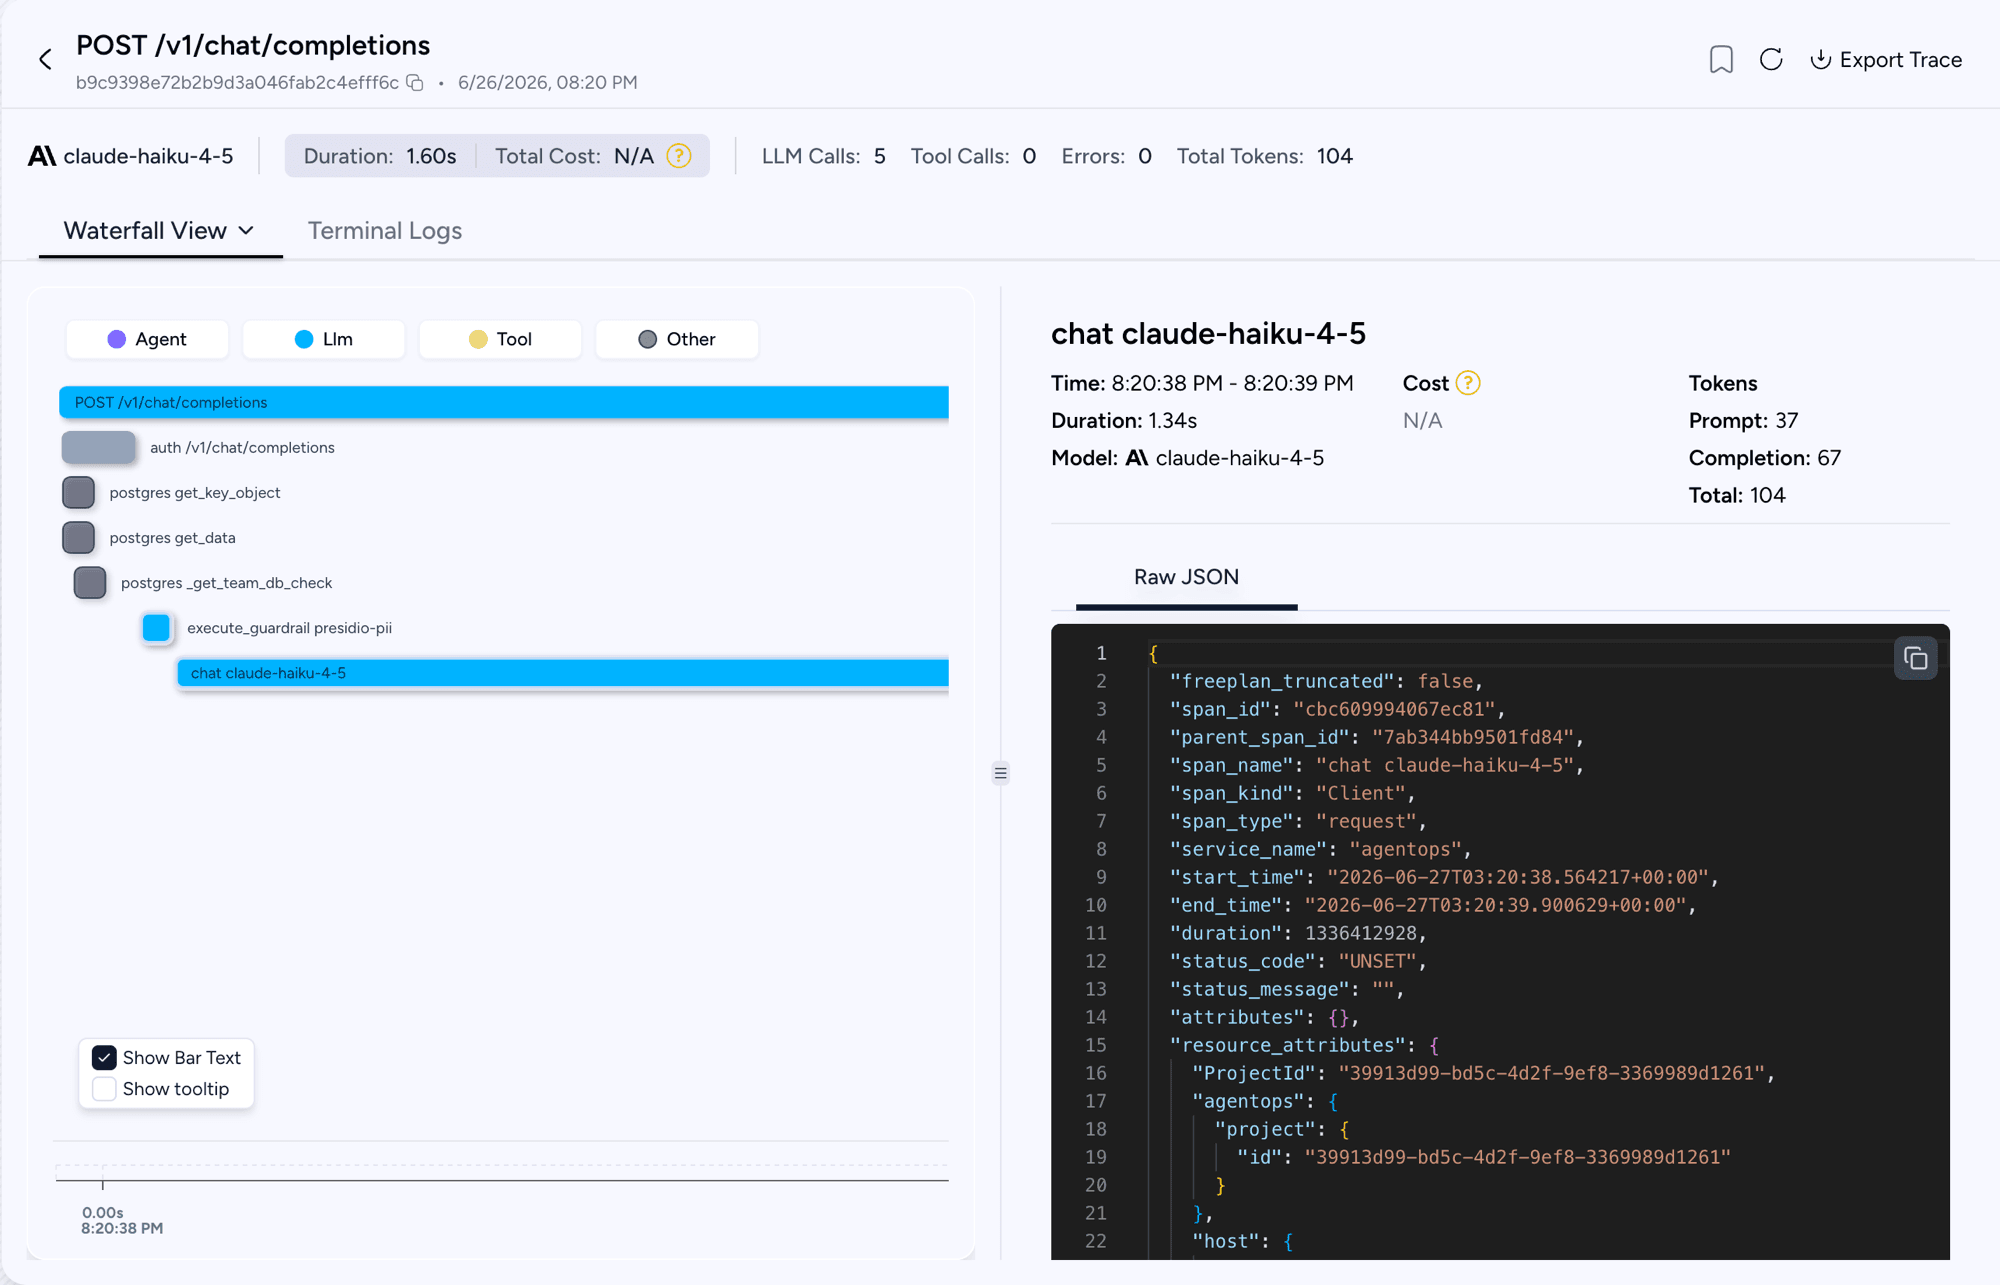
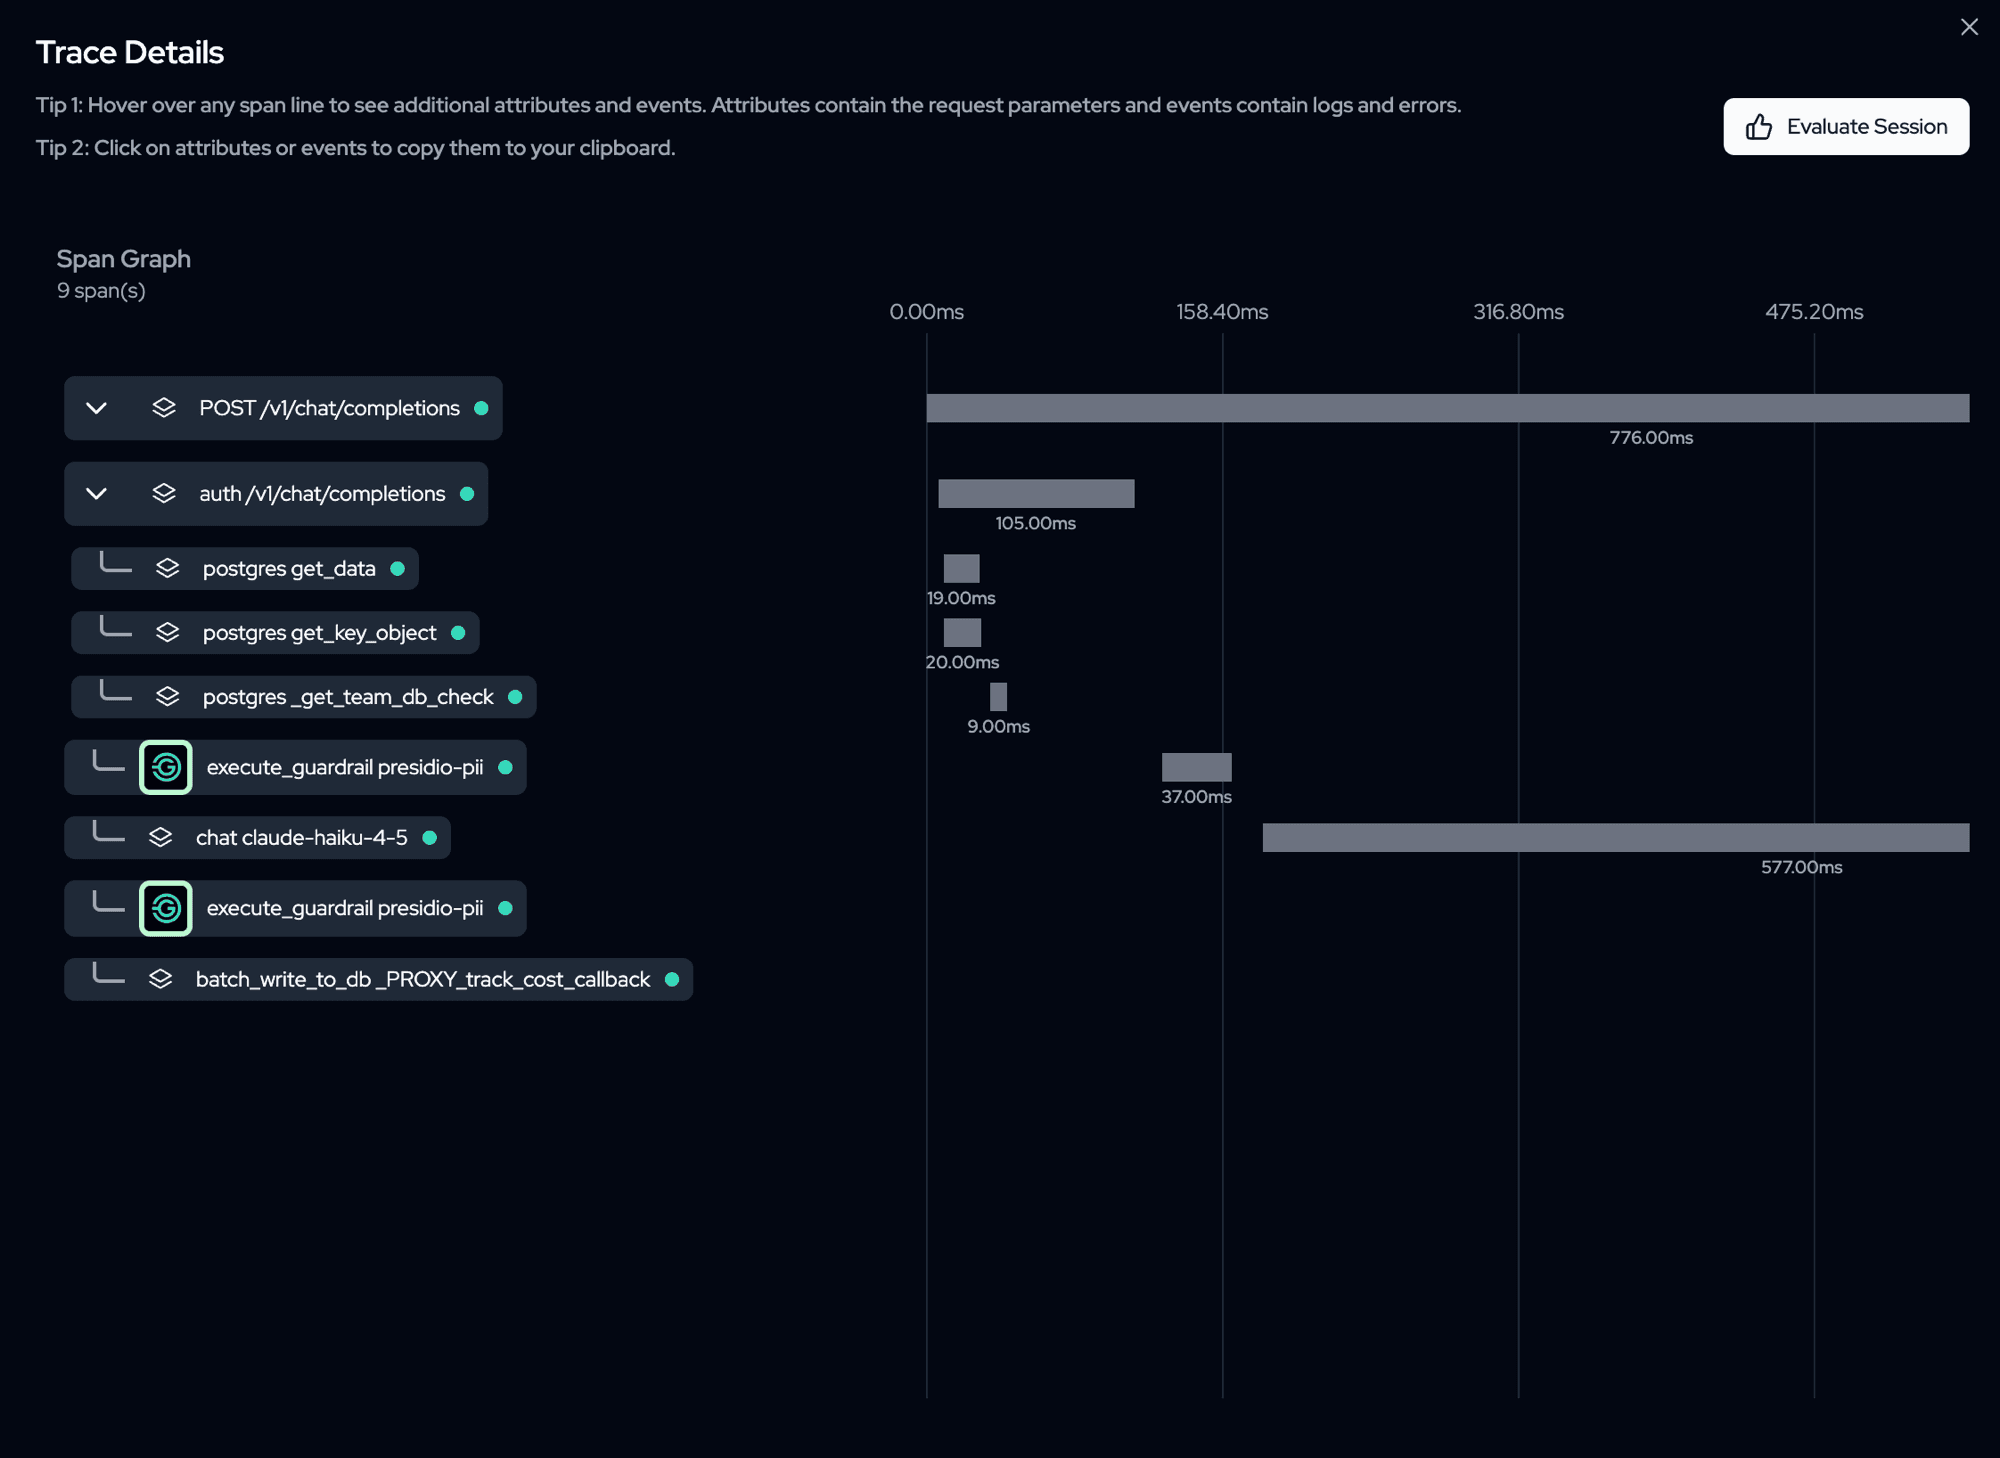
A single request to your proxy produces one trace that looks like this:
POST /v1/chat/completions                  ← HTTP request (server span)
├── auth /v1/chat/completions              ← authentication
│   ├── postgres get_key_object            ← DB lookups during auth
│   └── postgres get_team_membership
├── execute_guardrail presidio-pii         ← each guardrail that runs
├── chat gpt-5.6-terra                     ← the LLM call (model, tokens, cost)
└── batch_write_to_db                      ← spend/usage written to DB
Highlights:
- One trace, end to end — the HTTP request, auth, guardrails, the LLM call, and DB writes all live in the same trace, correctly nested.
- Rich GenAI attributes — every LLM-call span carries
gen_ai.*attributes: model, provider, token usage, cost, finish reasons, request parameters, and more. - Standards-based — built on the official OpenTelemetry GenAI semantic conventions, so it works with any OTel-compatible backend.
- Vendor presets — one line to ship traces to Arize, Phoenix, Langfuse, Weave, Langtrace, Levo, AgentOps, or SigNoz in the format each tool expects.
- Safe by default — prompts and responses are not captured unless you explicitly opt in. Noisy routes (health checks, metrics scrapes, UI assets) are excluded automatically.
- Distributed tracing — if your client sends a
traceparentheader, LiteLLM's spans nest inside your existing trace.
Getting started
For Auto Router configuration identity, selected models and recovered classifier failures, see Auto Router OTEL Telemetry.
Set LITELLM_OTEL_V2=true in the proxy environment, then pick a destination below.
1. Send traces to any OTLP collector
This path sends spans over OTLP (the OpenTelemetry Protocol) to a collector or backend you are already running at the endpoint below; if you do not have one yet, stay on the console exporter from the Quickstart until you do. Set the feature flag plus the standard OTEL_* environment variables in the proxy's environment. No config change is needed.
- OTLP HTTP collector
- OTLP gRPC collector
LITELLM_OTEL_V2=true
OTEL_EXPORTER="otlp_http"
OTEL_ENDPOINT="http://localhost:4318"
LITELLM_OTEL_V2=true
OTEL_EXPORTER="otlp_grpc"
OTEL_ENDPOINT="http://localhost:4317"
gRPC export needs
grpcio. Install withpip install grpcio.
Pass auth headers your backend needs via OTEL_HEADERS:
OTEL_HEADERS="api-key=your-key,x-tenant=acme"
Then start the proxy as usual:
litellm --config config.yaml
Make a request, and you'll see one trace per request in your backend.
Send to more than one collector
OTEL_ENDPOINT holds a single URL. To send every trace to several collectors at once, for example a Datadog Agent and Grafana Tempo, list them under callback_settings.otel.exporters in config.yaml and add otel to callbacks:
litellm_settings:
  callbacks: ["otel"]

callback_settings:
  otel:
    exporters:
      - kind: otlp_http
        endpoint: http://datadog-agent:4318
      - kind: otlp_grpc
        endpoint: http://tempo:4317
      - kind: otlp_http
        endpoint: https://collector.example.com
        headers: os.environ/COLLECTOR_HEADERS
Each entry becomes its own exporter, and every one of them receives the complete trace for each request, root span included. An entry takes a kind (otlp_http, otlp_grpc, or http/json for collectors that cannot decode protobuf), an endpoint, and optionally headers as comma-separated key=value pairs; os.environ/VAR keeps a header value out of the file. An otlp_http endpoint is a base URL that gets /v1/traces appended, so when a collector serves traces on another path, set traces_endpoint to the complete URL instead.
The list is read only when otel is in callbacks; without it the proxy falls back to the OTEL_* variables, or prints spans to stdout when those are unset. Once the list is set it replaces OTEL_EXPORTER, OTEL_ENDPOINT and OTEL_HEADERS for traces, while metrics and events keep going to the single OTEL_* destination. The list applies proxy-wide; a key or team cannot add a generic collector of its own (see Per-key / per-team credentials). OpenTelemetry v1 ignores the list.
If you would rather keep one endpoint in LiteLLM, point OTEL_ENDPOINT at an OpenTelemetry Collector and list your backends as exporters in its traces pipeline; the collector then copies each trace to all of them.
2. Send traces to a specific tool (presets)
For LLM observability tools, use a preset. A preset knows the tool's endpoint and emits attributes in the schema that tool expects. To enable one, add its name to callbacks in your config and set the tool's credentials as env vars.
- Arize
- Arize Phoenix
- Langfuse
- Weave (W&B)
- Langtrace
- Levo
- AgentOps
- SigNoz
litellm_settings:
  callbacks: ["arize"]
LITELLM_OTEL_V2=true
ARIZE_SPACE_ID="your-space-id"
ARIZE_API_KEY="your-api-key"
ARIZE_PROJECT_NAME="your-project-name"   # recommended: names the project traces land in
litellm_settings:
  callbacks: ["arize_phoenix"]
LITELLM_OTEL_V2=true
PHOENIX_API_KEY="your-api-key"
PHOENIX_COLLECTOR_ENDPOINT="https://app.phoenix.arize.com/v1/traces"
PHOENIX_PROJECT_NAME="my-project"   # optional
litellm_settings:
  callbacks: ["langfuse_otel"]
LITELLM_OTEL_V2=true
LANGFUSE_PUBLIC_KEY="pk-..."
LANGFUSE_SECRET_KEY="sk-..."
LANGFUSE_HOST="https://cloud.langfuse.com"   # or your self-hosted URL
litellm_settings:
  callbacks: ["weave_otel"]
LITELLM_OTEL_V2=true
WANDB_API_KEY="your-api-key"
WANDB_PROJECT_ID="your-entity/your-project"
Langtrace does not accept litellm's OTLP spans directly. It ingests JSON-encoded OTLP at a custom path (/api/trace) with an x-api-key header, whereas litellm v2 sends protobuf to /v1/traces. Run an OpenTelemetry Collector between them: litellm exports to the collector, and the collector re-encodes the spans to JSON and forwards them to Langtrace. The langtrace callback still applies Langtrace's attribute schema; the collector only handles delivery.
litellm_settings:
  callbacks: ["langtrace"]
LITELLM_OTEL_V2=true
OTEL_ENDPOINT="http://otel-collector:4318"
Collector config (otel-collector-config.yaml), with LANGTRACE_API_KEY set in the collector's environment:
receivers:
  otlp:
    protocols:
      http:
        endpoint: 0.0.0.0:4318
exporters:
  otlphttp/langtrace:
    encoding: json
    compression: none
    traces_endpoint: https://app.langtrace.ai/api/trace
    headers:
      x-api-key: ${env:LANGTRACE_API_KEY}
      Content-Type: application/json
service:
  pipelines:
    traces:
      receivers: [otlp]
      exporters: [otlphttp/langtrace]
litellm_settings:
  callbacks: ["levo"]
LITELLM_OTEL_V2=true
LEVOAI_API_KEY="your-api-key"
LEVOAI_ORG_ID="your-org-id"
LEVOAI_WORKSPACE_ID="your-workspace-id"
LEVOAI_COLLECTOR_URL="your-levo-collector-url"   # contact Levo support for this
litellm_settings:
  callbacks: ["agentops"]
LITELLM_OTEL_V2=true
AGENTOPS_API_KEY="your-api-key"
litellm_settings:
  callbacks: ["signoz"]
LITELLM_OTEL_V2=true
SIGNOZ_INGESTION_ENDPOINT="https://ingest.<region>.signoz.cloud:443"   # or your self-hosted collector, e.g. http://signoz-otel-collector:4318
SIGNOZ_INGESTION_KEY="your-ingestion-key"                              # omit for self-hosted SigNoz
To send the same traces to multiple vendors, list each preset in callbacks and set each one's env vars. For example, Langfuse and Arize together:
litellm_settings:
  callbacks: ["langfuse_otel", "arize"]
Each preset adds its own destination, so your spans reach all of them in parallel, each in that tool's native format. For several generic OTLP collectors rather than vendor tools, see Send to more than one collector.
Preset reference
Every preset turns into one exporter on a single shared tracer. The table lists, for each one, the callback name you put in callbacks, the credentials it reads, where it sends, the attribute vocabulary it adds on top of the canonical gen_ai.* keys, and whether it supports per-request (per-team/key) credentials.
| Preset | Callback | Required env vars | Optional env vars | Destination | Vocabulary | Per-request creds |
|---|---|---|---|---|---|---|
| Arize AX | arize | ARIZE_SPACE_ID (ARIZE_SPACE_KEY deprecated), ARIZE_API_KEY | ARIZE_PROJECT_NAME (names the project traces land in), ARIZE_ENDPOINT (gRPC, default https://otlp.arize.com/v1), ARIZE_HTTP_ENDPOINT (HTTP) | Arize AX platform | OpenInference | Yes |
| Arize Phoenix | arize_phoenix | PHOENIX_API_KEY (Phoenix Cloud only; self-hosted needs none) | PHOENIX_COLLECTOR_HTTP_ENDPOINT or PHOENIX_COLLECTOR_ENDPOINT (protocol inferred from the value), PHOENIX_PROJECT_NAME | Phoenix (self-hosted or Phoenix Cloud) | OpenInference | No |
| Langfuse | langfuse_otel | LANGFUSE_PUBLIC_KEY, LANGFUSE_SECRET_KEY | LANGFUSE_HOST (or LANGFUSE_OTEL_HOST; default https://us.cloud.langfuse.com, EU is https://cloud.langfuse.com), OTEL_IGNORE_CONTEXT_PROPAGATION (set true to drop inbound traceparent) | Langfuse Cloud or self-hosted | Langfuse | Yes |
| Weave (W&B) | weave_otel | WANDB_API_KEY, WANDB_PROJECT_ID (<entity>/<project>) | WANDB_HOST (default https://trace.wandb.ai) | Weights & Biases Weave | OpenInference + Weave | Yes |
| Langtrace | langtrace | none of its own | — | Langtrace, via an OpenTelemetry Collector (Langtrace ingests JSON-only OTLP) | Langtrace | No |
| Levo | levo | LEVOAI_API_KEY, LEVOAI_ORG_ID, LEVOAI_WORKSPACE_ID, LEVOAI_COLLECTOR_URL | — | Levo collector | canonical gen_ai.* only | No |
| AgentOps | agentops | AGENTOPS_API_KEY | AGENTOPS_SERVICE_NAME (default agentops), AGENTOPS_ENVIRONMENT (no default) | AgentOps (https://otlp.agentops.ai/v1/traces) | canonical gen_ai.* only | No |
| SigNoz | signoz | SIGNOZ_INGESTION_ENDPOINT (OTLP base URL; /v1/traces is appended) | SIGNOZ_INGESTION_KEY (sent as signoz-ingestion-key; omit for self-hosted) | SigNoz Cloud or self-hosted SigNoz, OTLP HTTP | canonical gen_ai.* only | Yes |
Notes:
- Arize AX vs Arize Phoenix: use
arizefor the full-featured AX platform andarize_phoenixfor Phoenix local or self-hosted workflows. They use different credentials and endpoints, so pick the callback for the backend you actually run. For product-specific setup, see the dedicated Arize AX and Arize Phoenix guides. - Langtrace ingests JSON-only OTLP at a custom path, so litellm v2 (which sends protobuf to
/v1/traces) cannot export to it directly. Route through an OpenTelemetry Collector that re-encodes to JSON; thelangtracepreset only adds the Langtrace attribute schema to your spans. See the Langtrace tab above for the collector config. - Vocabulary is additive: every preset's spans always carry the canonical OpenTelemetry
gen_ai.*attributes; the listed vocabulary is layered on top so the destination tool reads its native schema.
Seeing your traces
Once a backend is configured with its preset, each request shows up in that tool's UI as a chat <model> span under the request root. Each tab below covers the vendor-specific gotchas (project mapping, endpoint variants, metadata keys) that trip people up.
- Arize
- Arize Phoenix
- Langfuse
- Weave (W&B)
- AgentOps
- Langtrace
- Levo
- SigNoz
- Generic OTLP
What Arize renders
Open your Arize project; the trace appears under the project named by ARIZE_PROJECT_NAME. The openinference mapper stamps the OpenInference vocabulary onto the LLM-call span alongside the canonical gen_ai.* keys, so Arize reads its native schema without dropping the canonical ones.
Attributes added by the openinference mapper
| Attribute | Restates |
|---|---|
openinference.span.kind | Fixed LLM |
llm.model_name, llm.provider | model, provider |
llm.token_count.prompt, completion, total | usage split |
llm.invocation_parameters | JSON blob of request params |
llm.input_messages.{idx}.message.role, content | prompt (content capture on), capped |
llm.output_messages.{idx}.message.role, content | response (content capture on), capped |
llm.output_messages.{idx}.message.tool_calls.{idx}.tool_call.id, .tool_call.function.name, .tool_call.function.arguments | assistant tool calls (content capture on), see OpenInference tool calls and metadata |
metadata | JSON of the allowlisted request metadata, see OpenInference tool calls and metadata |
input.value, output.value | JSON arrays of every message's role and text, tool calls included (content capture on) |
llm.tools.{idx}.tool.name, description, json_schema | tool definitions, capped |
See the full OpenInference spec for the definitive vocabulary.
Setup notes
ARIZE_SPACE_KEYis the deprecated name forARIZE_SPACE_ID; the preset still reads it for backward compatibility, but preferARIZE_SPACE_IDin new configs.
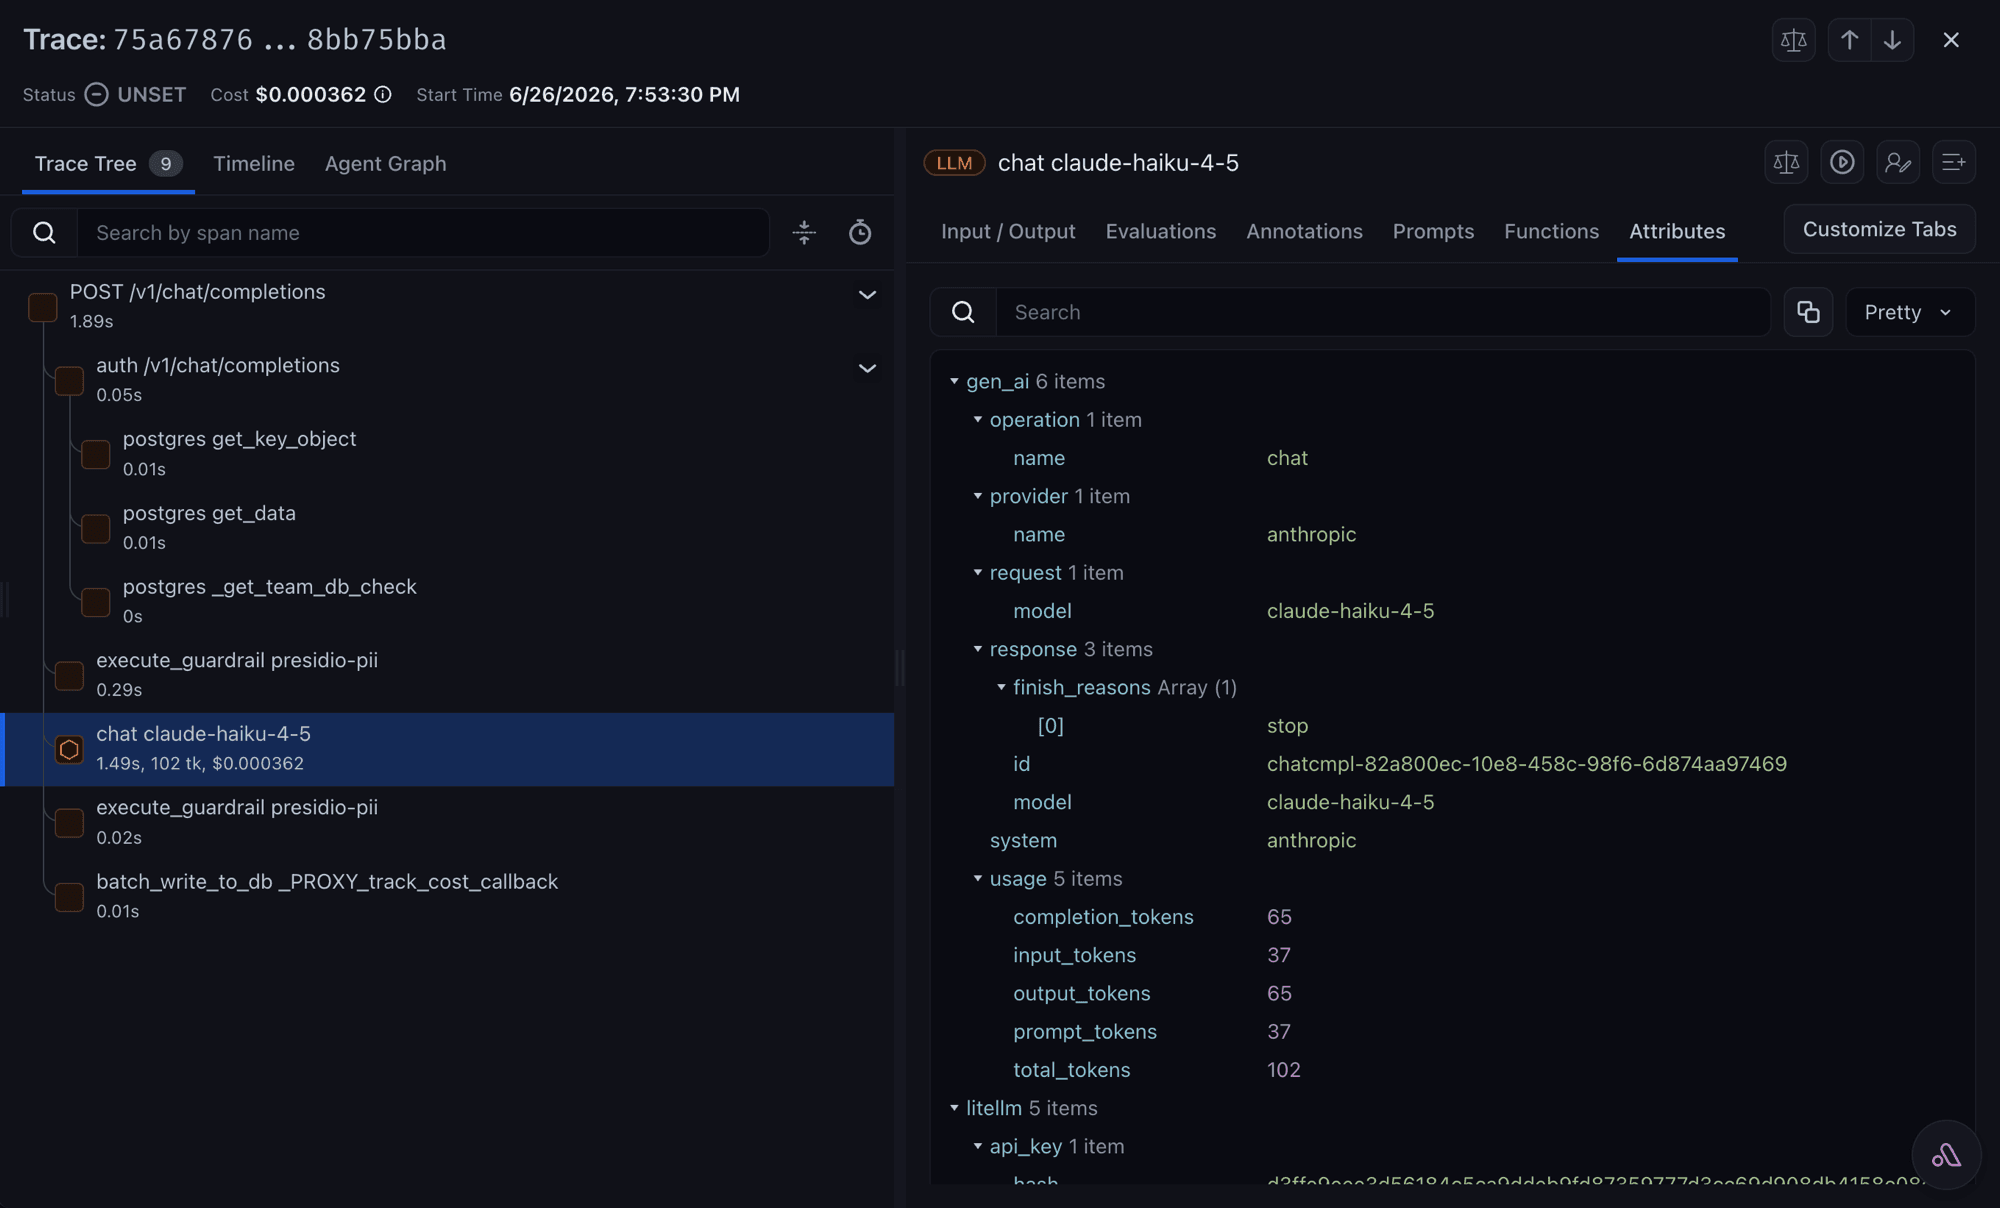
What Phoenix renders
Open Phoenix; the project comes from PHOENIX_PROJECT_NAME (default default), stamped as the openinference.project.name resource attribute. Phoenix uses the same OpenInference vocabulary as Arize AX.
On the proxy you can send a team's or key's LLM spans to a different Phoenix project on the same collector. Set phoenix_project_name on the team or key; see Route traces to a Phoenix project per team or key.
Attributes added by the openinference mapper
Same as the Arize tab above.
Setup notes
Phoenix has more than one collector endpoint shape, and picking the wrong one is the most common Phoenix setup mistake. Point PHOENIX_COLLECTOR_HTTP_ENDPOINT (or PHOENIX_COLLECTOR_ENDPOINT, which takes over when the first is unset) at the shape that matches your deployment. Neither variable is tied to a protocol: litellm infers it from the value, exporting over gRPC only for a grpc:// endpoint or a :4317 one without a /v1/traces path, and over HTTP otherwise.
| Deployment | Endpoint |
|---|---|
| Phoenix Cloud (Spaces) | https://app.phoenix.arize.com/s/<space-name>/v1/traces |
| Phoenix Cloud (legacy) | https://app.phoenix.arize.com/legacy/v1/traces |
| Phoenix Cloud (old) | https://app.phoenix.arize.com/v1/traces |
| Self-hosted | http://localhost:6006/v1/traces |
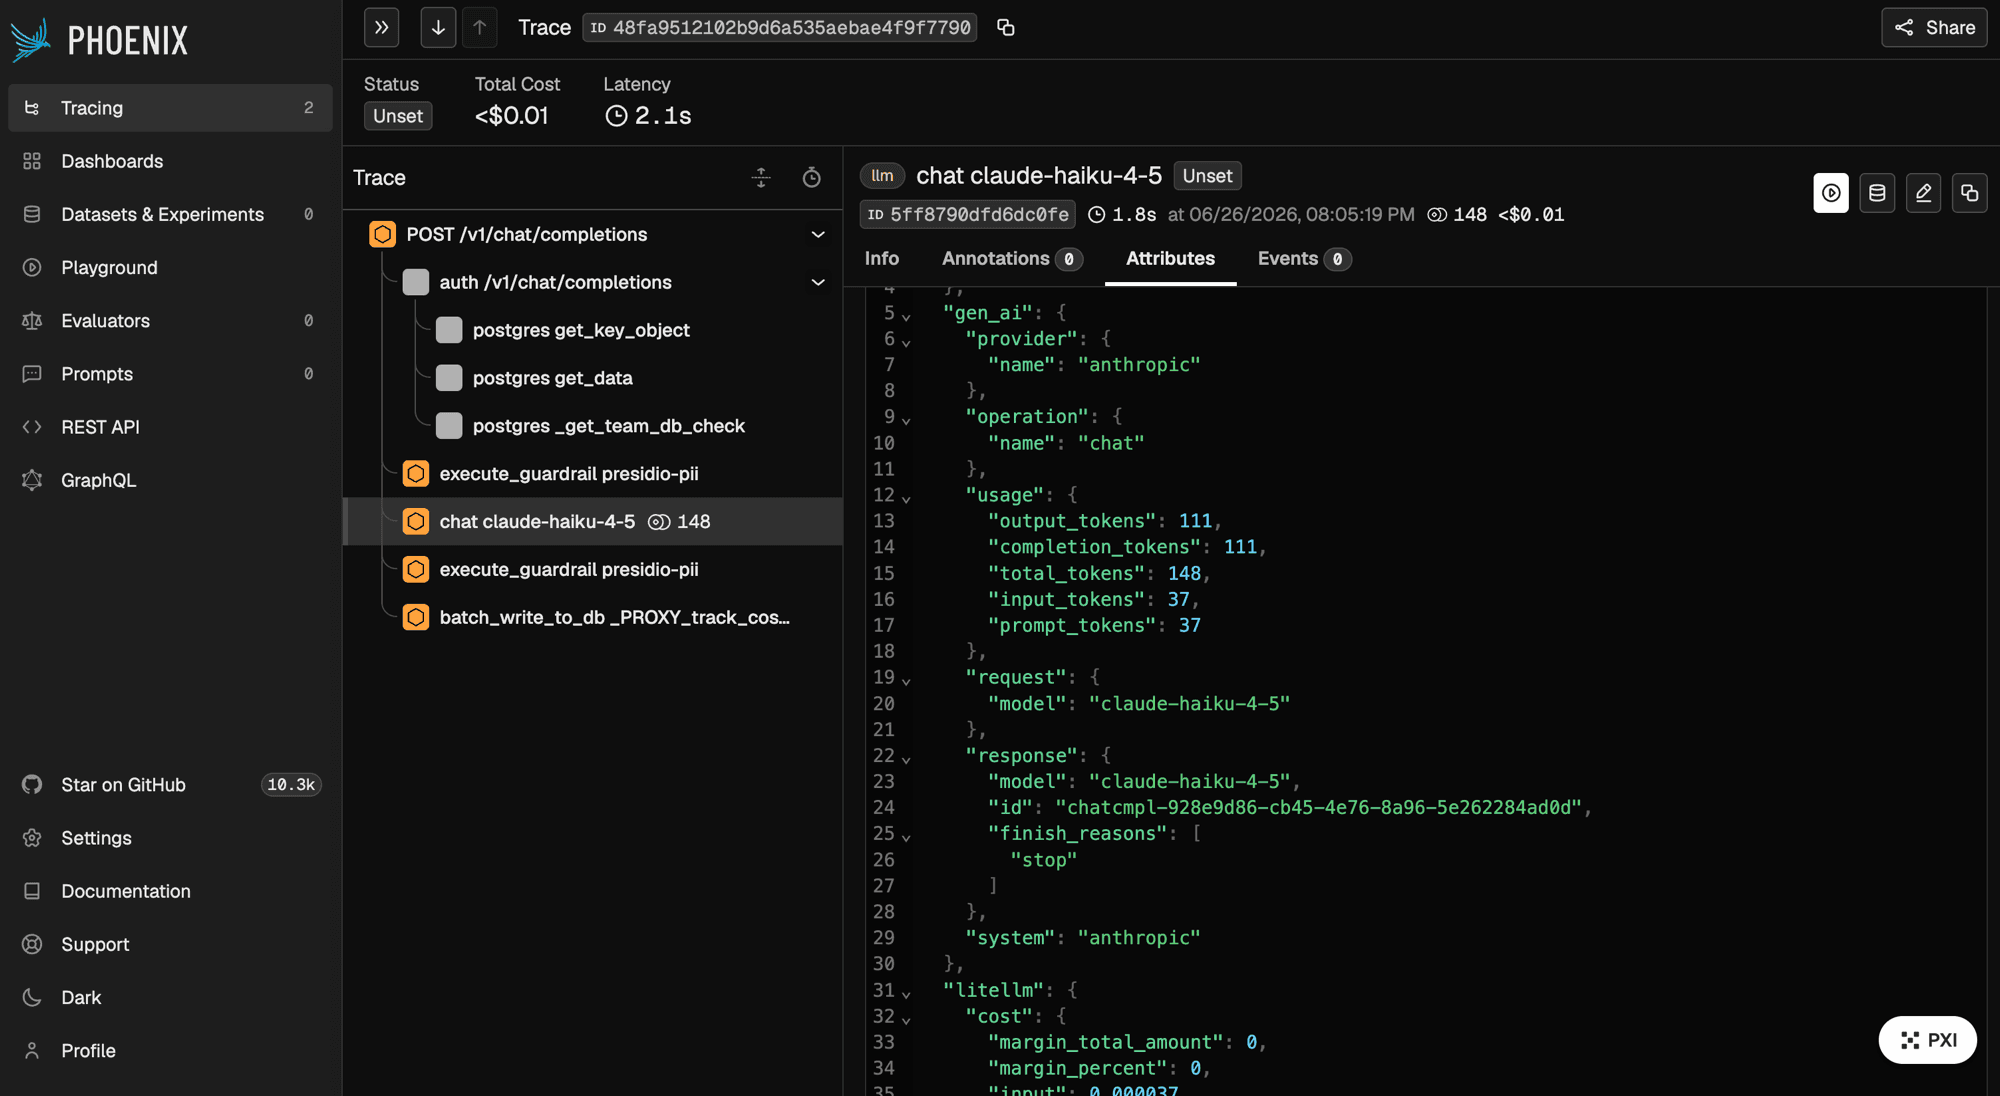
What Langfuse renders
Open the Langfuse traces view; the LLM-call span appears as a Langfuse generation, filterable by team. Endpoint resolution is LANGFUSE_OTEL_HOST, then LANGFUSE_HOST, then the US cloud default, with /api/public/otel appended for a self-hosted host.
Attributes added by the langfuse mapper
| Attribute | Purpose |
|---|---|
langfuse.observation.type | Fixed generation so this span appears as a model call |
langfuse.observation.model.name | Model shown on the generation |
langfuse.observation.model.parameters | JSON of request params (temperature, top_p, max_tokens, penalties, seed) |
langfuse.observation.id | Same as litellm.call_id |
langfuse.observation.input / output | Prompt and response bodies (content capture on) |
langfuse.observation.usage_details | Input/output/total token counts |
langfuse.observation.cost_details | Total cost |
langfuse.trace.metadata.team_id, team_alias | Filterable team identity |
These are set by the preset from the request and response, not from a client-supplied metadata dict, so you get them without extra config.
Setup notes
- Auth is HTTP Basic,
Authorization: Basic <base64(public_key:secret_key)>; the preset builds this fromLANGFUSE_PUBLIC_KEYandLANGFUSE_SECRET_KEYso you never set the header directly. - If your client already sends a W3C
traceparentand Langfuse is picking up the wrong parent, setOTEL_IGNORE_CONTEXT_PROPAGATION=truein the proxy environment to drop inbound context. - By default your Langfuse project receives the whole request tree. Set
LITELLM_OTEL_LANGFUSE_SPAN_SCOPE=llm_onlyto keep just the generations; see Send only the model calls to Langfuse. - This is a Langfuse-flavored path; for a general-purpose OTel backend, use the generic OTLP setup instead.
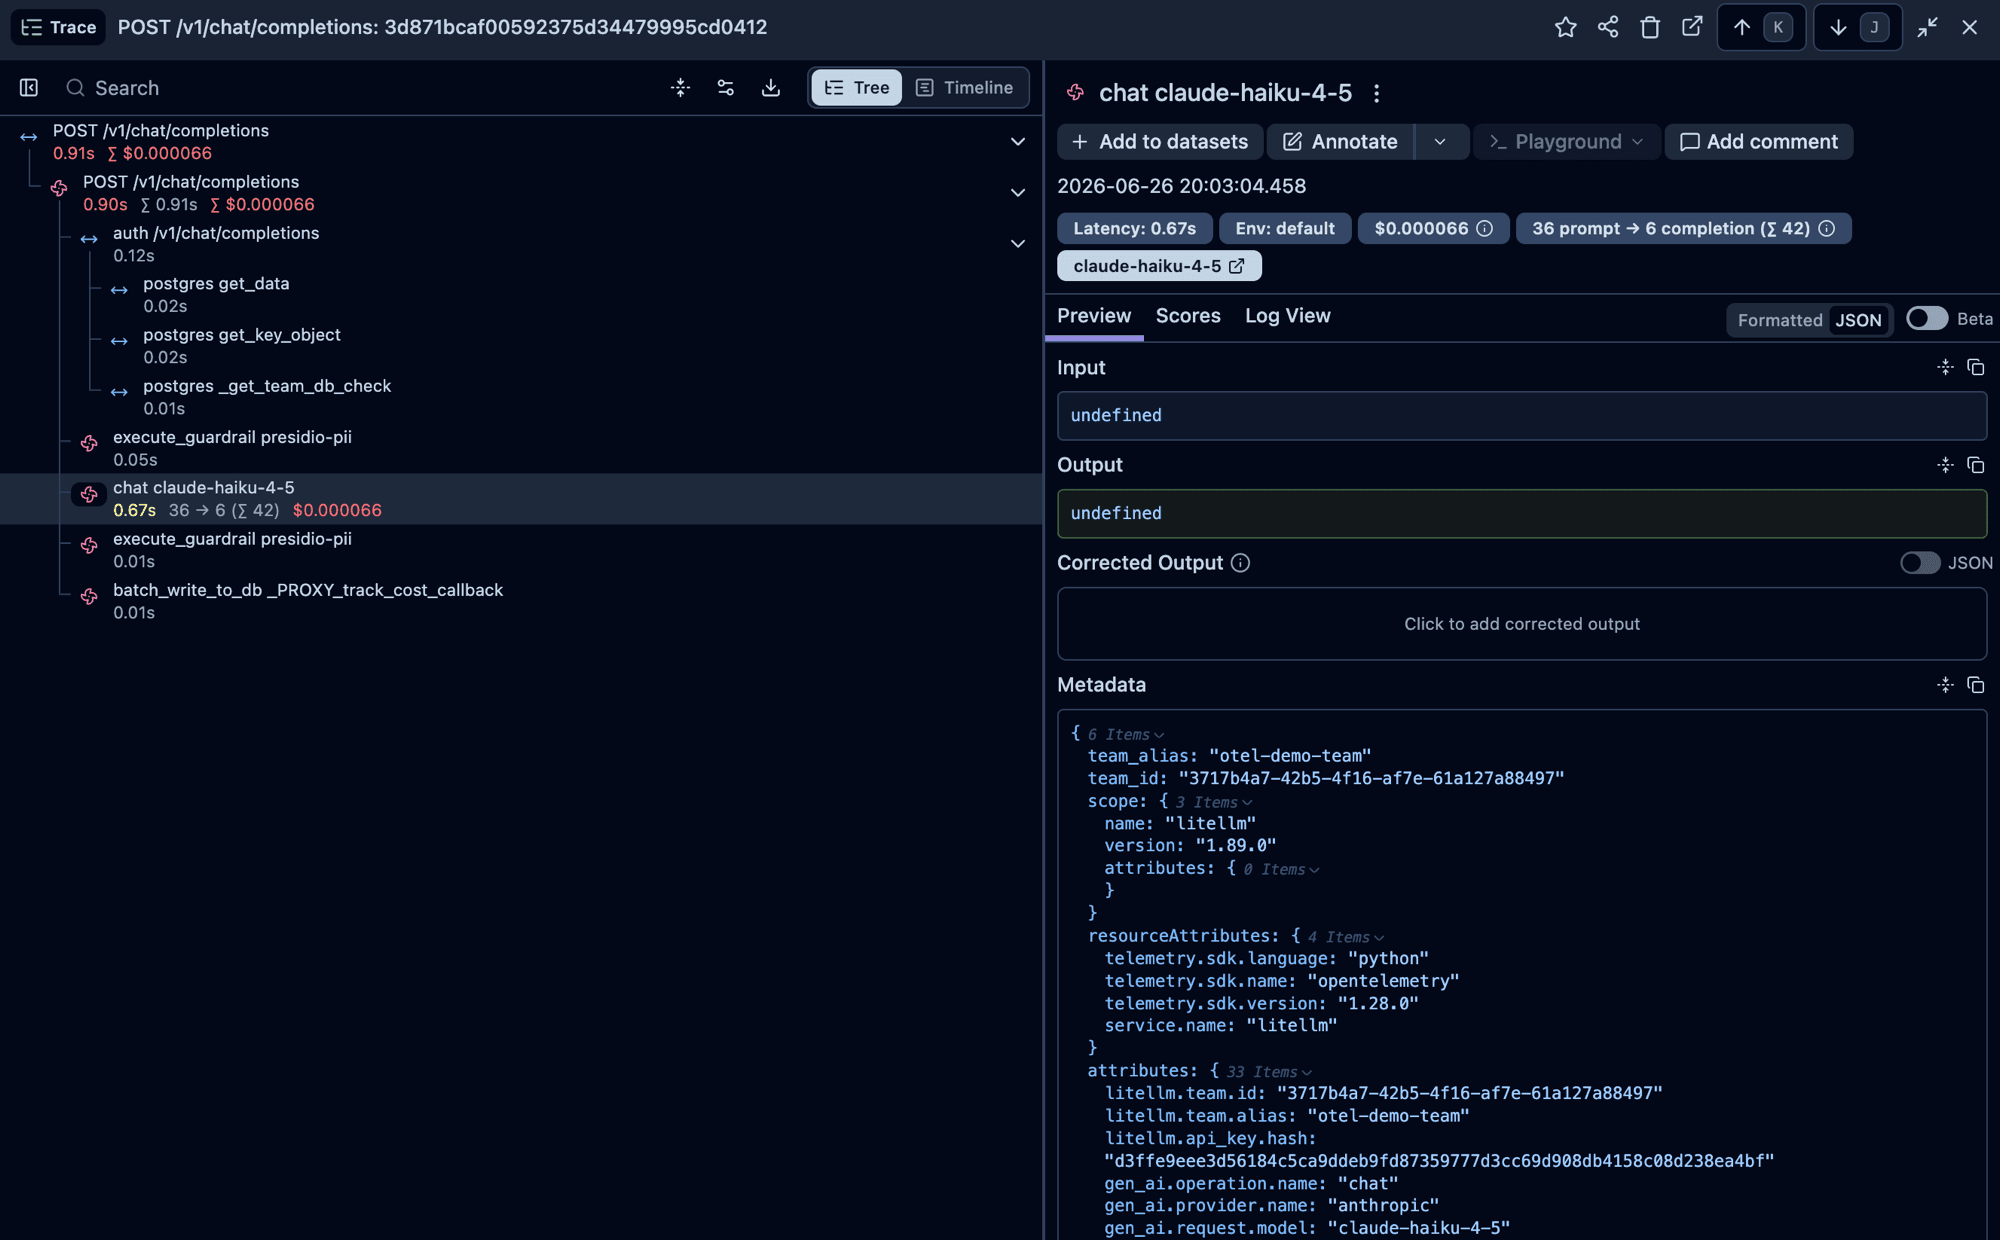
What Weave renders
Open the Weave project at wandb.ai/<entity>/weave. Weave consumes OpenInference plus a small Weave overlay, so the weave_otel preset composes both mappers on the same span.
Attributes added by the weave mapper
The openinference mapper (see the Arize tab) runs first, then the weave mapper adds:
| Attribute | Purpose |
|---|---|
weave.display_name | "{operation} {model}" (e.g. chat gpt-4o) |
weave.call_id | Same as litellm.call_id |
weave.output | JSON array of choices (content capture on) |
Setup notes
WANDB_PROJECT_IDmust be inentity/projectform, which is the most common setup mistake.- The
weave_otelpreset is the OTel-based Weave integration and is unrelated to the olderwandbsuccess-callback logger (which uses thewandbPython package and writes to W&B directly, not through OTel); see the W&B legacy page if you're looking for that one.
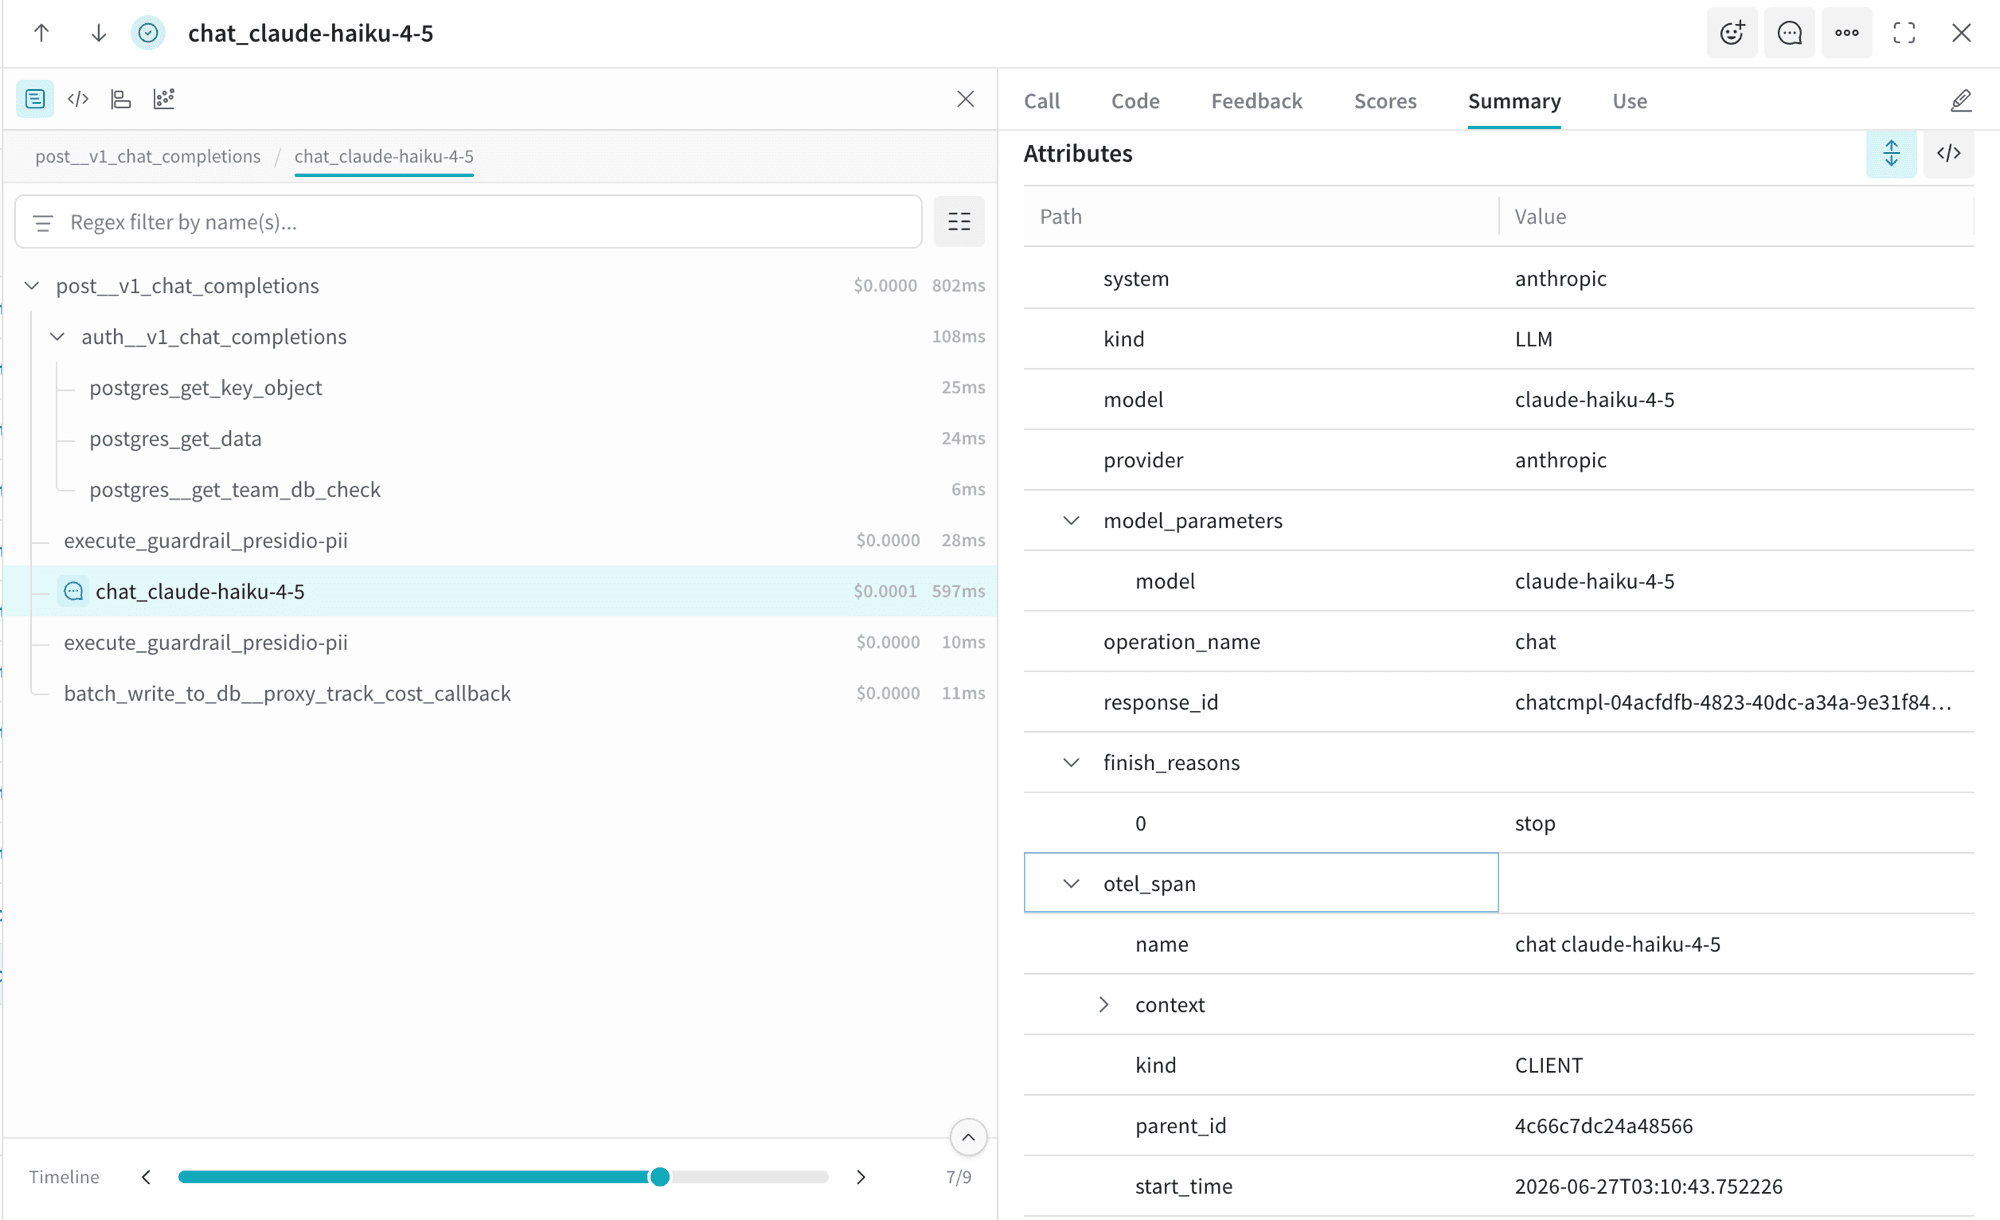
What AgentOps renders
Open the AgentOps dashboard. AgentOps does not add a vendor mapper, so spans arrive in the canonical gen_ai.* schema (plus legacy if enabled).
Attributes added by the AgentOps preset
No vendor mapper is added, so the LLM-call span carries only the canonical keys listed in Span attributes. The preset controls two resource-level labels on the traces:
| Attribute | Purpose |
|---|---|
service.name | From AGENTOPS_SERVICE_NAME (default agentops) |
deployment.environment | From AGENTOPS_ENVIRONMENT; only stamped when set |
Setup notes
- AgentOps mints its auth token on the first span export rather than at startup, so the very first export can look briefly delayed; this happens once per process and is expected.
- Set
AGENTOPS_SERVICE_NAME/AGENTOPS_ENVIRONMENTif you want to separate environments in the AgentOps UI.
What Langtrace renders
Open the Langtrace UI; the spans flow through your OpenTelemetry Collector carrying the langtrace.* and llm.* keys.
Attributes added by the langtrace mapper
| Attribute | Restates |
|---|---|
langtrace.service.name | provider |
llm.model, gen_ai.response.model, gen_ai.response_id, gen_ai.system_fingerprint | request/response identifiers |
llm.temperature, top_p, top_k, max_tokens, frequency_penalty, presence_penalty | request params |
llm.stream | streaming flag |
llm.token.counts.prompt, completion, total | usage split |
llm.prompts, llm.completions | JSON arrays (content capture on) |
Setup notes
Langtrace ingests JSON-only OTLP at a custom path, so litellm exports through an OpenTelemetry Collector that re-encodes to JSON. See the Langtrace tab under Getting started for the collector configuration.
What Levo renders
Open the Levo dashboard. Levo does not add a vendor mapper, so spans arrive in the canonical gen_ai.* schema (plus legacy if enabled).
Attributes added by the Levo preset
No vendor mapper is added. Traces carry only the canonical keys from Span attributes. The preset routes spans to LEVOAI_COLLECTOR_URL with Authorization: Bearer $LEVOAI_API_KEY, plus x-levo-organization-id and x-levo-workspace-id headers built from LEVOAI_ORG_ID and LEVOAI_WORKSPACE_ID.
Setup notes
- The collector URL is used as-is, no path manipulation, so provide the exact URL Levo gave you.
- To label spans with an environment, set
OTEL_ENVIRONMENT_NAME; the Levo preset reads no environment variable of its own beyond the four required ones.
What SigNoz renders
Open Traces and filter by the service named in OTEL_SERVICE_NAME (default litellm). Each request is one trace with the server span at the root and the chat <model> span under it; the span detail view lists the gen_ai.* and litellm.* attributes, and the Related Logs button opens log lines correlated by trace id.
Attributes added by the SigNoz preset
No vendor mapper is added. Spans carry only the canonical keys from Span attributes, which is what SigNoz's LLM views and its LiteLLM dashboard templates read.
Setup notes
SIGNOZ_INGESTION_ENDPOINTis the OTLP base URL for both SigNoz Cloud (https://ingest.<region>.signoz.cloud:443) and a self-hosted collector (http://<host>:4318). The preset appends/v1/traces; a value that already ends in/v1/tracesis used as is. An unset or empty value fails at startup with an error naming the variable, and nothing is exported.SIGNOZ_INGESTION_KEYis optional. When set it is sent as thesignoz-ingestion-keyheader; when unset no auth header is sent, which is the self-hosted case.- Per-team and per-key routing is supported, including a per-tenant endpoint. See SigNoz.
What a generic OTLP backend renders
Whatever your backend's UI shows for standard OTel GenAI spans. The generic preset (and the plain env-var OTLP path from Getting started section 1) does not add a vendor mapper.
Attributes added
None beyond the canonical gen_ai.* and litellm.* keys listed in Span attributes, plus the legacy Traceloop keys if LITELLM_OTEL_LEGACY_COMPAT=true.
Setup notes
Use this path for Jaeger, Grafana Tempo, Honeycomb, Datadog, Splunk Observability Cloud, and any other backend that consumes standard OTLP. SigNoz has its own signoz preset with per-team ingestion keys; see SigNoz. If a backend is not listed above and there is no dedicated tab, this is the one to use. For Grafana Cloud specifically, see Grafana Cloud, which covers the OTLP gateway's auth format and the prebuilt GenAI dashboards.
Capturing prompts & responses
By default, OTel v2 records metadata only (model, tokens, cost, timing) and never writes prompt or response text to your traces. This is intentional, and it keeps sensitive content out of your observability backend.
To capture message content, opt in explicitly:
# no_content (default) — never capture prompts/responses
OTEL_INSTRUMENTATION_GENAI_CAPTURE_MESSAGE_CONTENT="no_content"

# span_only — write prompts/responses as attributes on spans
OTEL_INSTRUMENTATION_GENAI_CAPTURE_MESSAGE_CONTENT="span_only"

# event_only — write prompts/responses on log events instead of span attributes
OTEL_INSTRUMENTATION_GENAI_CAPTURE_MESSAGE_CONTENT="event_only"

# span_and_event — write content to both spans and events
OTEL_INSTRUMENTATION_GENAI_CAPTURE_MESSAGE_CONTENT="span_and_event"
The gate is enforced centrally, so it applies to every backend at once. A user request can never force its prompt into your backend while capture is disabled.
Span attributes
Attributes come from a chain of mappers stamped onto each span in order. The canonical genai mapper is always applied first, the legacy compatibility mapper is on by default, and each preset adds one vendor mapper on top. Later mappers can override earlier ones; the same span therefore carries several vocabularies describing the same call.
The first two tables cover the LLM-call span in the canonical vocabulary. Sections below list the other span kinds, then what each vendor mapper adds.
LLM-call span, canonical gen_ai.* + litellm.*
Request-side keys:
| Attribute | When set |
|---|---|
gen_ai.operation.name | always (chat, text_completion, embeddings) |
gen_ai.provider.name | always |
gen_ai.request.model | always (the user-facing model group name) |
gen_ai.request.temperature, top_p, top_k, max_tokens | when set on the request |
gen_ai.request.frequency_penalty, presence_penalty, seed | when set |
gen_ai.request.stop_sequences | when set (string array) |
gen_ai.tool.{idx}.name, description, parameters | one set per tool definition, for the leading tools only (why) |
litellm.request.tools.declared | when the request declares tools; the full count, capped or not |
server.address, server.port | when the provider endpoint is known |
Tool definitions are capped
Only the leading declared tools get gen_ai.tool.{idx}.* attributes. Tool definitions are an unbounded attribute family, one entry per tool per field per active vocabulary, and OpenTelemetry caps a span at 128 attributes by default. An agent that declares a hundred or more tools would otherwise blow past that ceiling, and because the limit evicts the oldest attributes first, the gen_ai.* attributes above would be the ones discarded, leaving a span carrying nothing but tool schemas. The cap keeps model, token usage, and cost on the span no matter how many tools a request declares.
The ceiling is span-wide, not per vocabulary. Tool definitions may claim a quarter of the span's attribute budget in total, and that allowance is split across the vocabularies that emit them, so the number of tools detailed depends on how many are active: 5 tools each under the default genai plus legacy pair, 3 tools each once a vendor vocabulary such as openinference is layered on. Splitting it this way is what stops three vocabularies spelling the same tools out from summing back past the limit.
litellm.request.tools.declared always carries the true total, so you can tell when the per-tool detail was truncated. Requests declaring fewer tools than the allowance keep full detail.
Chat messages are capped
The openinference mapper's llm.input_messages.{idx}.* and llm.output_messages.{idx}.* keys are the other unbounded family: two attributes per message, prompt and response alike. Past a few dozen turns they alone would exceed the 128-attribute default and evict the gen_ai.* model, usage, cost, and finish-reason attributes written before them. They are therefore fitted to the budget the span has left: its tracer provider's attribute count limit (OTEL_SPAN_ATTRIBUTE_COUNT_LIMIT, or the SpanLimits of an injected or per-request routed provider) minus every other attribute on the span, error.* included. A conversation that fits is indexed in full. One that does not loses whole messages, role and content together, least valuable first: middle prompt turns, then extra response choices, then message 0 and the newest turn, and last the first choice. Surviving messages keep their original indices, so message 0 and the newest turns stay addressable even when OTEL_SPAN_ATTRIBUTE_VALUE_LENGTH_LIMIT clips the input.value blob before the end of the conversation. With genai plus openinference and LITELLM_OTEL_LEGACY_COMPAT=false, a 60-turn conversation with one reply at the default limit indexes llm.input_messages.0, .18 through .59, and llm.output_messages.0; the default legacy mapper adds keys of its own, so fewer middle turns survive with it on.
The cap only touches the per-index convenience keys. input.value and output.value still list every message's role and text, and the canonical gen_ai.input.messages and gen_ai.output.messages blobs carry the full message objects (tool calls and non-text parts included), so the whole conversation stays on the span and Arize keeps rendering it. Those blobs are single strings, so OTEL_SPAN_ATTRIBUTE_VALUE_LENGTH_LIMIT (unlimited by default) can truncate them on a long conversation; the surviving per-index keys then still show the opener and the newest turns. Phoenix compacts the per-index keys into a dense list when it renders a span, so a gap in indices shows up there as a shorter message list, in the same order.
Response, usage, cost, identity:
| Attribute | When set |
|---|---|
gen_ai.response.id, gen_ai.response.model | on success |
gen_ai.response.finish_reasons | on success (string array) |
gen_ai.usage.input_tokens, gen_ai.usage.output_tokens | on success |
gen_ai.input.messages, gen_ai.output.messages | content capture on |
gen_ai.system_instructions | content capture on, when a system prompt is present |
litellm.call_id | always |
litellm.provider.model | always (the model string actually sent to the provider) |
litellm.request.streaming | when true |
litellm.request.route | on the proxy (the same route the root span reports as http.route: the FastAPI route template, e.g. /v1/responses/{response_id}, or the literal path on a passthrough prefix such as /openai/...; when no server span exists, for example the route is in OTEL_PYTHON_FASTAPI_EXCLUDED_URLS or the FastAPI instrumentation is not installed, it falls back to the route the proxy recorded at auth) |
litellm.cost.total | on success |
litellm.cost.input, output, cache_read, cache_creation, tool_usage | when the source reported the breakdown |
litellm.cost.original, discount_amount, discount_percent, margin_fixed_amount, margin_percent, margin_total_amount | when reported |
Status and errors:
- On failure: the span records the standard
exceptionevent (exception.type,exception.message), setserror.typefrom the exception class, and sets its status toERROR. - On success: the status is left
UNSET(the semconv default, matching the FastAPI server span). Only a genuine error setsERROR, so do not key an alert on a status ofOK.
Other span kinds
Guardrail span, which uses the litellm.guardrail.* namespace: name, mode, status, provider, action, response, violation_categories, confidence_score, risk_score, masked_entity_count, duration, id, policy_template, detection_method. status is one of success, guardrail_intervened, guardrail_failed_to_respond, or not_run; a blocking guardrail_intervened or guardrail_failed_to_respond also sets span status to ERROR.
Datastore span (redis, postgres): db.system.name, db.operation.name, litellm.service.name, litellm.service.call_type.
Internal service span: the litellm.service.* keys only (no db.*).
MCP tool-call span: gen_ai.operation.name=execute_tool, mcp.method.name, mcp.session.id, gen_ai.tool.name, litellm.mcp.server.name, litellm.call_id, litellm.cost.total. gen_ai.tool.call.arguments and gen_ai.tool.call.result are gated by the same content-capture setting as prompt content.
Root HTTP server span: the HTTP semconv keys http.request.method, http.route, http.response.status_code, url.path, stamped by the FastAPI instrumentation (not by any of LiteLLM's mappers).
Each vendor preset also composes one vendor-specific mapper on top of these canonical keys, so the destination reads the trace in its native schema. Those per-vendor tables live under the matching Seeing your traces tab.
Attribute conventions
LiteLLM emits one canonical set of GenAI attributes and layers other vocabularies on top by adding a mapper; the active set is controlled by mapper_names, with genai always first. The legacy mapper is on by default (LITELLM_OTEL_LEGACY_COMPAT=true) and re-emits the same data under the older semconv-ai / Traceloop names, so dashboards built against those keep working through a migration. Turn it off with LITELLM_OTEL_LEGACY_COMPAT=false once your queries use the canonical keys. Vendor mappers (openinference, langfuse, weave, langtrace) are added by their presets and never replace the canonical keys.
mapper_names itself defaults to genai alone, so on the generic OTLP path a span carries only the canonical names until you add more. Set it with the MAPPER_NAMES env var, comma-separated (MAPPER_NAMES=genai,openinference), which every path reads, or as callback_settings.otel.mapper_names in config.yaml, a YAML list read on the otel callback path. The values stack: list two and every span carries both name sets, with genai moved to the front whatever order you write. The presets stamp their own mapper on top of whatever you set, so arize, arize_phoenix, and weave_otel carry openinference with no extra setting. Naming openinference yourself is what gets tool calls and metadata rendered natively in Arize and Phoenix; see OpenInference tool calls and metadata.
The most common keys line up across vocabularies as follows:
Canonical (genai) | Legacy (Traceloop) | OpenInference |
|---|---|---|
gen_ai.usage.input_tokens | gen_ai.usage.prompt_tokens | llm.token_count.prompt |
gen_ai.usage.output_tokens | gen_ai.usage.completion_tokens | llm.token_count.completion |
gen_ai.provider.name | gen_ai.system | llm.provider |
litellm.request.streaming | llm.is_streaming | n/a |
gen_ai.request.model | n/a | llm.model_name |
OpenInference tool calls and metadata
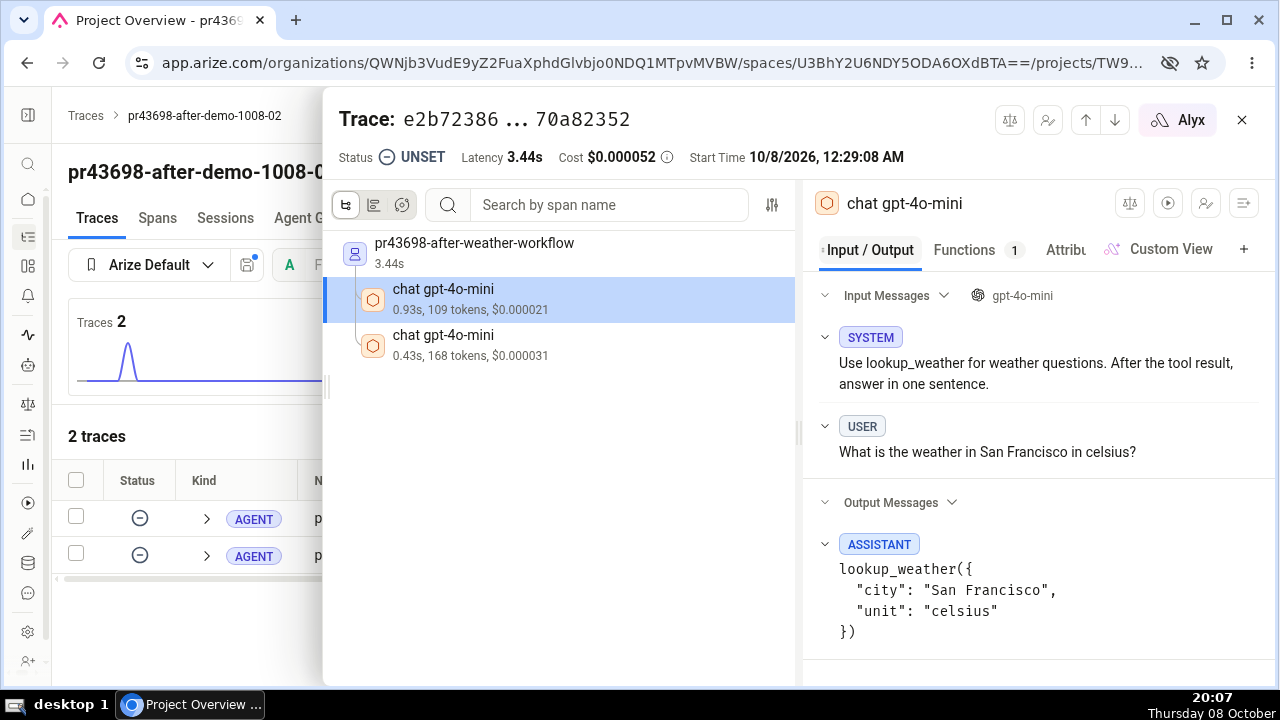
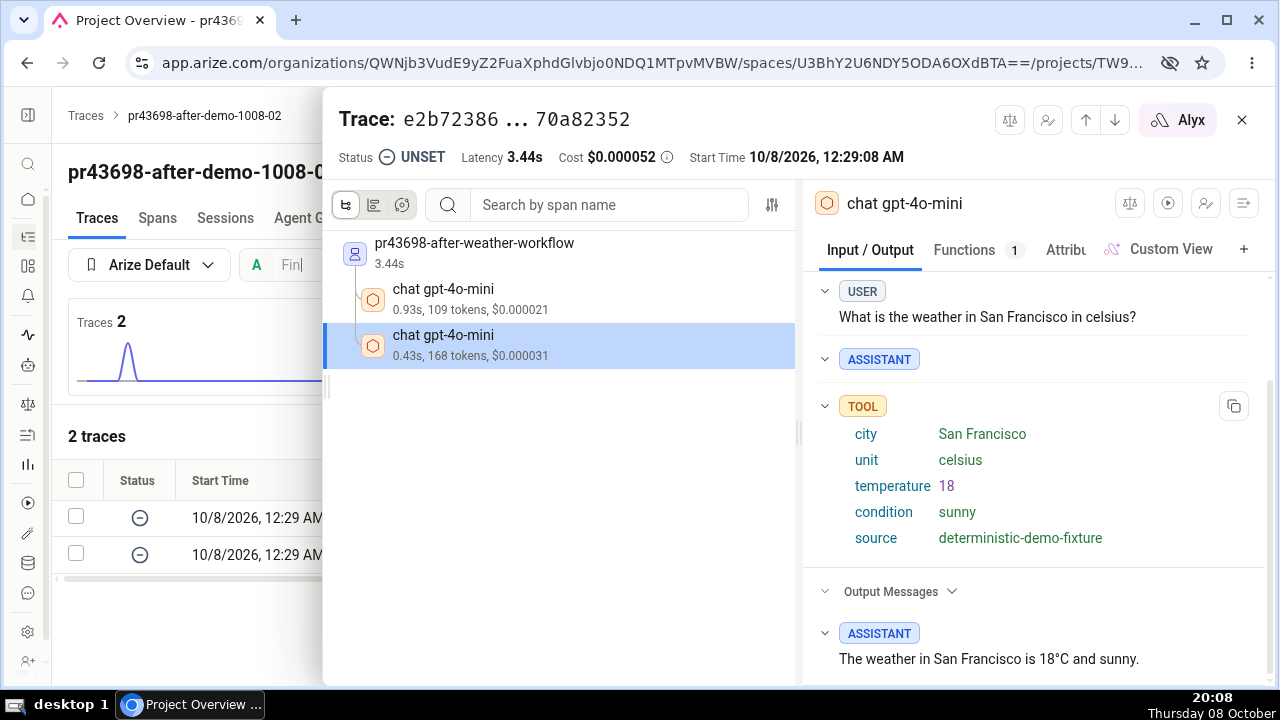
With the openinference mapper active, each LLM-call span carries the model's output tool calls as structured attributes and a metadata attribute holding the allowlisted request metadata, on top of the keys in the Arize table above. Before, Arize and Phoenix showed a tool-calling reply as {"role": "assistant", "content": null} and left the span's metadata panel empty: the tool call lived only as text inside the input.value blob, and the request's metadata only under the litellm.metadata.* namespace.
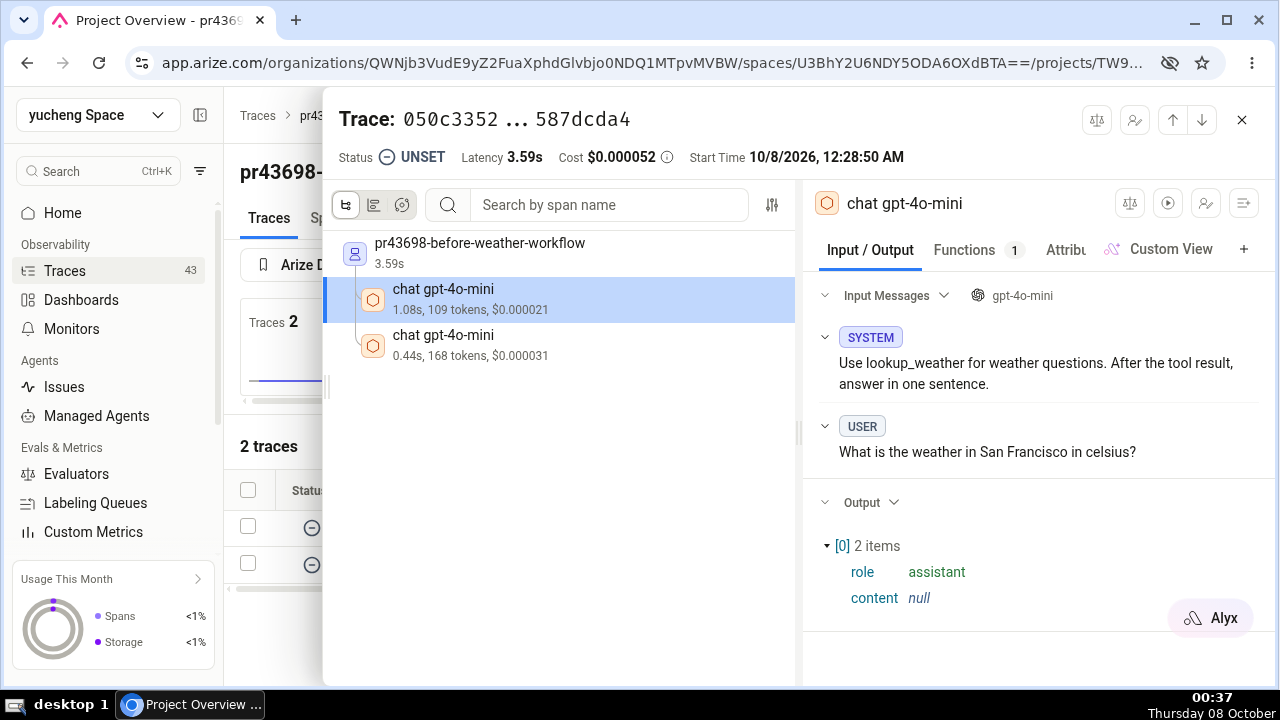
Tool calls on output messages
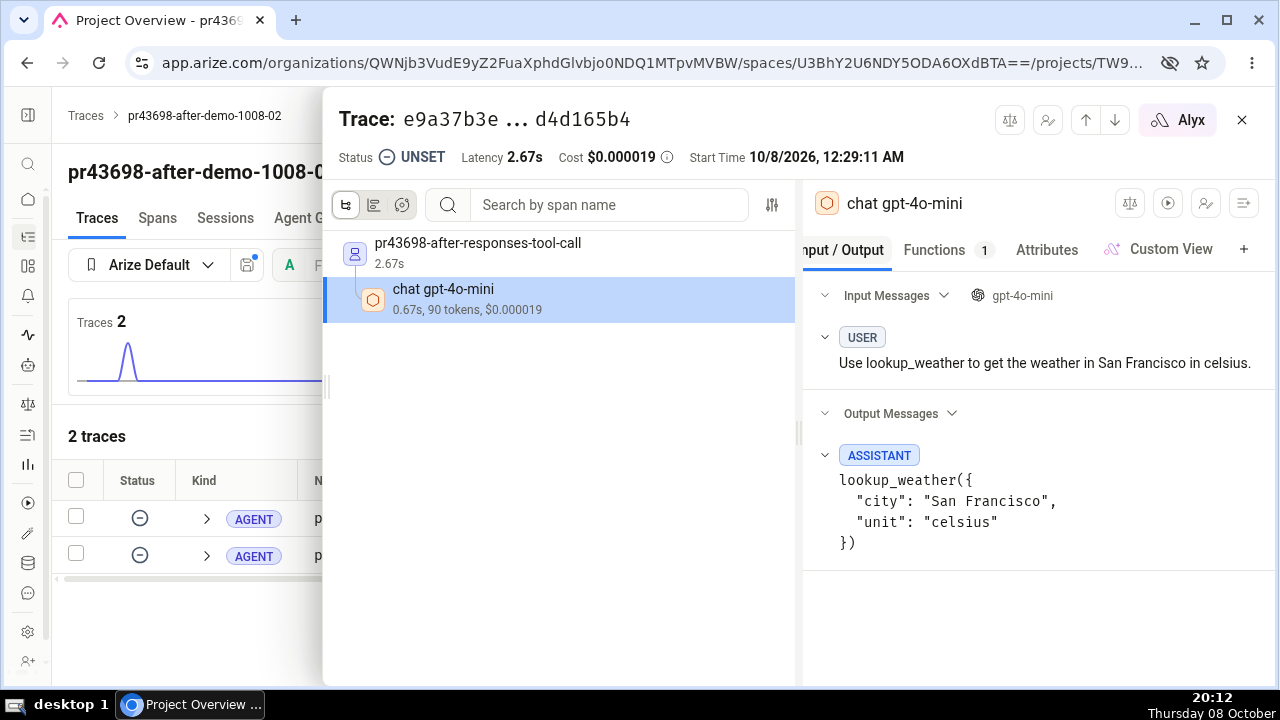
Each assistant tool call is written as its own indexed attribute family, so Arize and Phoenix render the tool name and its arguments as first-class fields you can read, filter, and group by. One tool call on the first output message looks like this:
llm.output_messages.0.message.tool_calls.0.tool_call.id = "call_uXEPx7V2yQk5IwXzzGxL0mf9"
llm.output_messages.0.message.tool_calls.0.tool_call.function.name = "lookup_weather"
llm.output_messages.0.message.tool_calls.0.tool_call.function.arguments = "{\"city\": \"Paris\"}"
tool_call.function.arguments is a JSON string of the arguments the model produced. A value Python cannot JSON-encode falls back to that value's repr string, so the attribute is always present. Tool calls in the prompt's earlier turns stay inside the input.value and gen_ai.input.messages blobs rather than getting their own indexed keys, because indexing the whole history would crowd out the keys above on long conversations. Whichever surface the caller used, /v1/chat/completions, /v1/responses, or /v1/messages, the reply's tool calls land in the same llm.output_messages.* keys. Like the message role and content keys, the tool-call keys are written when content capture is on (span_only or span_and_event).
The metadata attribute
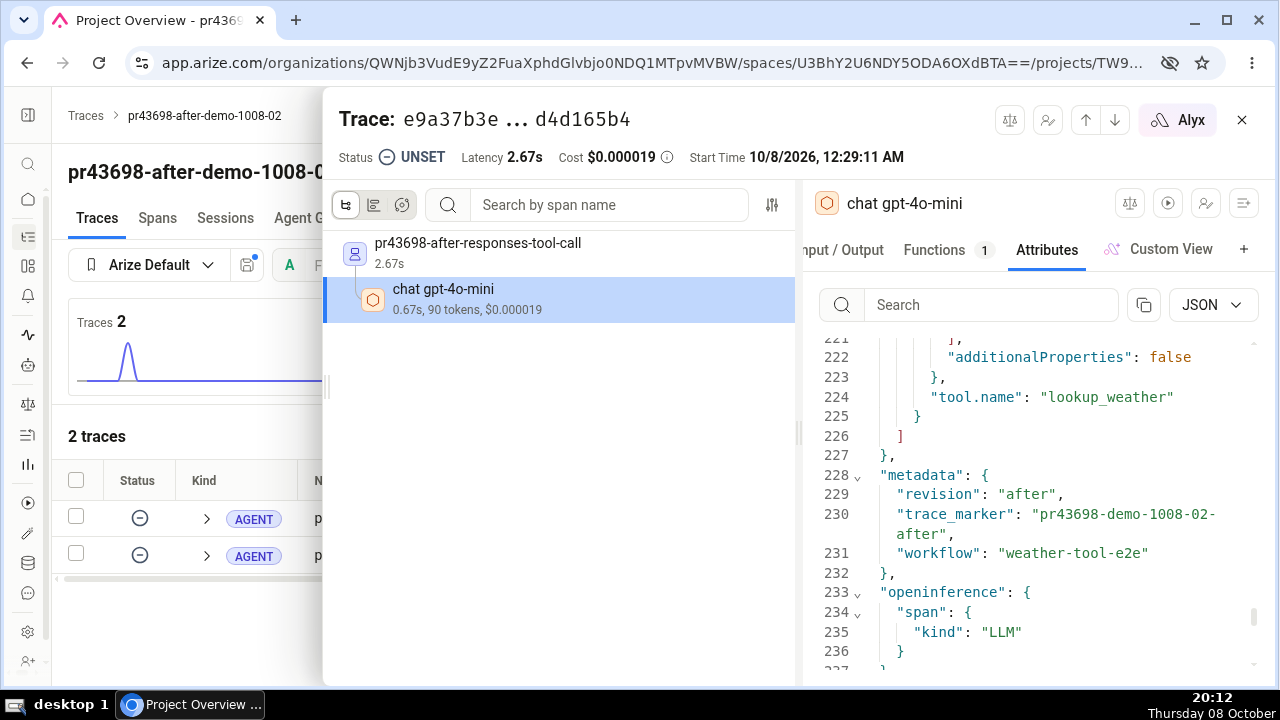
The span also carries a metadata attribute: a JSON object holding only the promoted, allowlisted subset of the request's metadata, the same allowlist that feeds the litellm.metadata.* namespace documented in Request identity on every span. The raw metadata dict a caller sends is never written whole, and litellm.metadata.* keeps exactly the shape it had before. With the default allowlist, metadata holds user_api_key_org_id, user_api_key_user_id, user_api_key_alias, user_api_key_end_user_id, and requester_ip_address:
metadata = {"user_api_key_alias": "demo-key-alias", "requester_ip_address": "203.0.113.7"}
To promote your callers' own keys into it, use the same LITELLM_OTEL_BAGGAGE_METADATA_KEYS setting (a dotted requester_metadata.trace_marker reads the caller's nested metadata.trace_marker). Arize and Phoenix show this attribute as the span's Metadata panel and let you filter and group traces by it. Note that the default allowlist names the caller's IP address and key alias; if that is more than you want in your observability backend, set the allowlist explicitly.
A response-cache hit opens no LLM-call span, so a served-from-cache reply shows neither the tool calls nor metadata in Arize or Phoenix; the request that populated the cache carried both.
The mapper, not just the endpoint
Setting the Arize or Phoenix OTLP endpoint gets spans delivered, and both tools accept them, but on the generic OTLP path they arrive carrying only the canonical gen_ai.* names and render as plain spans: no per-message rows, no structured tool calls, no metadata panel. The two settings answer two different questions. The endpoint decides where spans go; mapper_names decides which attribute names get written on them.
To get native rendering while shipping through your own collector or the plain OTLP path, name the openinference mapper next to the endpoint. Self-hosted Phoenix:
litellm_settings:
  callbacks: ["otel"]

callback_settings:
  otel:
    mapper_names: ["genai", "openinference"]
LITELLM_OTEL_V2=true
OTEL_EXPORTER="otlp_http"
OTEL_ENDPOINT="http://localhost:6006"
Arize AX over its default gRPC endpoint (pip install grpcio for gRPC export), with the credentials as OTLP headers:
LITELLM_OTEL_V2=true
OTEL_EXPORTER="otlp_grpc"
OTEL_ENDPOINT="https://otlp.arize.com/v1"
OTEL_HEADERS="space_id=your-space-id,api_key=your-api-key"
MAPPER_NAMES=genai,openinference   # env alternative to the YAML list above
If you use the arize or arize_phoenix preset you already have this: the presets stamp openinference onto every span with no extra setting, which is the configuration behind the screenshots above. Spans that do not carry the openinference mapper are byte-for-byte what they were before, so generic-OTLP setups that add nothing see no change.
Attribute budget
The indexed OpenInference keys add up: with openinference on, count roughly 18 extra attributes per LLM-call span, measured on a single-turn chat call. The span-wide 128-attribute cap, and how the per-index message keys are fitted into the budget the span has left, is covered in Chat messages are capped and Tool definitions are capped; the tool-call keys count against that same budget. When a span is tight, the mapper sheds the later tool-call groups first, then middle-message indexes, and metadata only after every indexed message attribute. Very long conversations still lose middle-message indexes; the full conversation, tool calls included, always survives in the input.value and output.value blobs.
Request identity on every span
LiteLLM writes a small allowlist of request-identity values into standard OpenTelemetry Baggage at the auth boundary. A custom span processor then copies those values onto every span in the trace, so a guardrail, datastore, or service span is filterable by team or key without LiteLLM re-stamping each one by hand.
By default the following keys are written onto every span:
| Key | Value |
|---|---|
litellm.team.id | Team UUID |
litellm.team.alias | Team display name |
litellm.team.metadata | Team's free-form metadata, filtered to the sub-keys you allowlist |
litellm.api_key.hash | Hash of the caller's virtual key |
gen_ai.request.model | User-facing model group name |
litellm.provider.model | Dispatched model on the provider |
A separate set of request-metadata fields is written under the litellm.metadata.* namespace. Defaults:
litellm.metadata.user_api_key_org_id, litellm.metadata.user_api_key_user_id, litellm.metadata.user_api_key_alias, litellm.metadata.user_api_key_end_user_id, litellm.metadata.requester_ip_address.
Two defaults stay conservative for privacy. The end-user id is promotable but off by default at the top level (it identifies an individual); it appears under litellm.metadata.user_api_key_end_user_id, which callers who filter by user should enable. A team's free-form metadata is never emitted whole; only the sub-keys you allowlist leave the process, and the allowlist is empty by default.
Override any of these with the LITELLM_OTEL_BAGGAGE_PROMOTED_KEYS, LITELLM_OTEL_BAGGAGE_METADATA_KEYS, and LITELLM_OTEL_BAGGAGE_TEAM_METADATA_KEYS env vars (comma-separated), or the matching YAML lists under callback_settings.otel.
Metrics
Alongside traces, OTel v2 can emit GenAI client metrics: histograms for call latency, token usage, and cost that your backend aggregates across requests. Like the rest of OTel v2 they stay off until you turn them on.
Set the flag in the proxy environment next to LITELLM_OTEL_V2:
LITELLM_OTEL_V2=true
LITELLM_OTEL_INTEGRATION_ENABLE_METRICS=true
Metrics ship through the exporter you already configured for traces. OTEL_EXPORTER (console, otlp_http, otlp_grpc), OTEL_ENDPOINT, and OTEL_HEADERS decide where the metric stream goes exactly as they do for spans, so the collector that receives your traces receives the metrics too. A callback_settings.otel.exporters list does not change this: it routes traces only, and metrics keep following the OTEL_* variables.
What's recorded
Each successful LLM call records the standard OpenTelemetry GenAI client metrics:
| Metric | Unit | What it measures |
|---|---|---|
gen_ai.client.operation.duration | s | Wall-clock time for the whole LLM call |
gen_ai.client.token.usage | {token} | Tokens consumed, split into input and output by the gen_ai.token.type attribute |
gen_ai.usage.cost | USD | LiteLLM's computed cost for the call |
gen_ai.server.time_to_first_token | s | Time to the first streamed token (streaming calls) |
gen_ai.server.time_per_output_token | s | Average time per output token |
gen_ai.client.response.duration | s | Provider-side generation time |
gen_ai.usage.cost, gen_ai.server.time_to_first_token, and gen_ai.server.time_per_output_token were previously emitted as gen_ai.client.token.cost, gen_ai.client.response.time_to_first_token, and gen_ai.client.response.time_per_output_token. The older spellings are not GenAI semantic conventions and no vendor dashboard queries them, so nothing prebuilt could chart LiteLLM's cost or latency. If you hand-built panels or alerts against the old names, repoint them at the names above
Every sample carries the same identity attributes as the matching span (operation, provider/system, request model, framework, and selected metadata.* fields), so you can group the histograms by model, provider, key, or team. These are the same six metrics the v1 OpenTelemetry integration emits, with identical names and units, so a dashboard built for one reads the other.
Control metric attribute cardinality
By default every metric sample is stamped with the full identity attribute set, which includes per-request fields such as hidden_params and several metadata.* values. Those are close to unique per request, so each one multiplies the number of time series your backend tracks (one series per distinct attribute combination). At volume this explodes metric cardinality, and some backends, for example Splunk Observability Cloud, start throttling or dropping the metrics.
v2 reads the same filter v1 does, from callback_settings.otel.attributes in your config. Nest an attributes block there with either an include_list (allowlist; emit only the listed attributes) or an exclude_list (denylist; emit everything except the listed attributes). The two are mutually exclusive. The filter applies to metrics only; spans keep their full attribute set, so traces stay rich while metric cardinality stays bounded.
The block sits under callback_settings.otel. With LITELLM_OTEL_V2 set, listing otel in callbacks builds the v2 logger and reads this block (it builds the legacy v1 logger only when the flag is off); the block is also read on the default path when no otel callback is listed.
Unlike v1, v2 has no per-instance attributes field, so this global block is the only source. v2 also resolves the filter lazily on the first metric a request records rather than at boot, so a bad config (both lists set, or a forbidden name) surfaces on that first recorded request and editing the lists takes effect only after a restart. The filter is read only on the default OTLP path (callback name otel or unset); preset destinations such as arize, arize_phoenix, and langfuse_otel emit their metrics with the full attribute set, the same as in v1.
callback_settings:
  otel:
    attributes:
      exclude_list:
        - hidden_params
        - metadata.requester_metadata
        - metadata.requester_ip_address
        - metadata.spend_logs_metadata
        - metadata.mcp_tool_call_metadata
        - metadata.vector_store_request_metadata
        - metadata.prompt_management_metadata
When you want the smallest, most predictable attribute set, list exactly the attributes to keep with include_list. Anything not listed is dropped from metrics:
callback_settings:
  otel:
    attributes:
      include_list:
        - gen_ai.operation.name
        - gen_ai.system
        - gen_ai.request.model
        - gen_ai.framework
        - metadata.user_api_key_team_id
        - metadata.user_api_key_org_id
gen_ai.token.type is never filtered out. It is stamped on gen_ai.client.token.usage after the filter runs, so the input/output split survives whatever list you set, and naming it in either include_list or exclude_list is rejected.
Which routes are traced
High-frequency, non-LLM routes are excluded by default so they don't flood your traces: health checks (/health*), the Prometheus scrape (/metrics), and static UI/docs assets (/ui, /docs, /redoc, /_next, /openapi.json, favicons, …).
To change the set, use the standard OpenTelemetry env var (comma-separated paths, substring-matched):
# Trace everything, including health checks
OTEL_PYTHON_FASTAPI_EXCLUDED_URLS=""

# Exclude only your own custom paths
OTEL_PYTHON_FASTAPI_EXCLUDED_URLS="/health,/internal"
Per-key / per-team credentials (multi-tenant)
One proxy can serve many tenants: a team or a virtual key carries its own backend credentials, so its traces land in that tenant's own Langfuse project, Arize space, Weave project, New Relic account, or SigNoz account instead of the proxy-wide one. The credentials come from the key and the team the proxy resolved at auth, never from the request body, so a caller cannot pick another tenant's backend.
This is the same key/team callback mechanism described in Team/Key based logging; v2 applies it to the OTel presets. There is no separate admin-owned "destination" object, and /credentials holds LLM provider credentials, not logging ones.
Which presets support per-request credentials
| Preset | Callback | Fields on the key or team | What varies per tenant |
|---|---|---|---|
| Langfuse | langfuse_otel | langfuse_public_key, langfuse_secret_key, langfuse_host | The Langfuse project traces land in, and the server they are sent to |
| Arize AX | arize | arize_space_id (or the deprecated arize_space_key), arize_api_key | The Arize space |
| Weave (W&B) | weave_otel | wandb_api_key, weave_project_id | The W&B account and Weave project |
| New Relic | newrelic | newrelic_api_key, newrelic_region (us or eu, default us) | The New Relic account and its data center |
| SigNoz | signoz | signoz_ingestion_key, signoz_ingestion_endpoint | The SigNoz account, and optionally the SigNoz Cloud region or self-hosted collector it is sent to |
Every other preset (arize_phoenix, langtrace, levo, agentops) and the plain otel OTLP exporter has no per-request credentials, so those always export with the proxy-wide configuration. For Phoenix, split tenants by project instead of by backend, with phoenix_project_name on the team or key. To keep one backend but label a tenant's spans with its own service.name, set otel_service_name in the key's or team's metadata instead.
Set it on a team
Register the callback on the team; every key on that team then exports with these credentials:
curl -X POST 'http://localhost:4000/team/<team-id>/callback' \
  -H "Authorization: Bearer $LITELLM_API_KEY" -H 'Content-Type: application/json' \
  -d '{
    "callback_name": "langfuse_otel",
    "callback_type": "success",
    "callback_vars": {
      "langfuse_public_key": "pk-lf-...",
      "langfuse_secret_key": "sk-lf-..."
    }
  }'
GET /team/<team-id>/callback reads back what a team has registered, DELETE /team/<team-id>/callback/<callback_name> removes one integration, and POST /team/<team-id>/disable_logging removes all of them.
Set it on a key
A key can carry its own credentials in metadata.logging, including a key with no team:
curl -X POST 'http://localhost:4000/key/generate' \
  -H "Authorization: Bearer $LITELLM_API_KEY" -H 'Content-Type: application/json' \
  -d '{
    "metadata": {
      "logging": [{
        "callback_name": "arize",
        "callback_type": "success",
        "callback_vars": {"arize_space_id": "...", "arize_api_key": "..."}
      }]
    }
  }'
Existing keys take the same field on /key/update. You can also fill both of these in from the Admin UI, on the team's or the key's logging settings.
What the tenant receives
A key or team that names its own backend gets the whole trace under one root: the HTTP request, the auth step, the model call with its tokens and cost, and the spend write. Before, it received a single loose span with no request around it.
Your own exporter for that same backend stops receiving those requests. If a team points langfuse_otel at its own project, your Langfuse project holds nothing for that team; exporters on other backends, a plain otel collector for instance, still receive everything.
The tenant's copy is stripped of your side of the request: the proxy's database endpoint, exception text and stack traces, an unreachable guardrail's error, and the query string on any URL.
If the tenant's backend is unreachable, its spans are not re-routed to your exporters. The point of the override is that you stop holding that team's traffic.
Keep your own copy as well
Switch the mode to additive and your exporter keeps every request too, so an org-wide view stays complete:
litellm_settings:
  otel_tenant_destination_mode: additive   # default: "override"
LITELLM_OTEL_TENANT_DESTINATION_MODE=additive does the same. When a team happens to name a project you already export to, the request is written once, not twice.
Send a tenant to its own Langfuse host
langfuse_host on a key or team moves that tenant's traces to their own Langfuse server. Pass it with the key pair it belongs to, because a host on its own is ignored. Allowlist the host too, or the proxy logs a warning and leaves the request on your exporters:
litellm_settings:
  provider_url_destination_allowed_hosts: ["langfuse.acme.com"]
Your own LANGFUSE_HOST needs no allowlist entry. SigNoz works the same way: signoz_ingestion_endpoint on a key or team, passed together with signoz_ingestion_key, moves that tenant's traces to its own SigNoz Cloud region or collector, and its host must be allowlisted; an endpoint without a key or off the allowlist is ignored with a warning. See SigNoz per-team routing. The other presets take their endpoint from the proxy's environment; only the credentials vary per tenant, plus New Relic's region, picked from a fixed us/eu table.
Send only the model calls to Langfuse
By default a Langfuse project, yours or a tenant's, receives the whole request tree: the HTTP request root, the auth step, database and cache lookups, every guardrail run, MCP tool calls, the model call and the spend write. If you only want the generations in Langfuse, set the scope to llm_only. The proxy keeps the model-call spans and stops forwarding every other span of that request to that Langfuse project. A model-call span is the one the proxy emits for each provider call it made on the caller's behalf, whatever the route: chat and text completions, Responses API calls, embeddings, image, audio and OCR generation, moderation, vector store calls and agent messages all count. They are the spans carrying gen_ai.operation.name, minus MCP tool calls. The generation keeps its trace id, so Langfuse still groups the generations of one request under one trace, and it keeps the caller's langfuse.trace.name, user.id, session.id and langfuse.trace.tags. Since the request root is no longer sent, that Langfuse project receives the generation as the root of the trace, and when the caller set no langfuse_trace_name or metadata.trace_name the trace takes the generation's own name, chat claude-3-5-haiku for instance, instead of showing up unnamed. Only that project's copy of the span is changed; a full project or a plain collector receiving the same request still sees the generation under the request span. When a tenant's full project is the same Langfuse account as your own llm_only exporter, that account gets the whole tree once and the generation stays in its place under the request span
A team or key sets it in its langfuse_otel callback next to its credentials:
curl -X POST 'http://localhost:4000/team/<team-id>/callback' \
  -H "Authorization: Bearer $LITELLM_API_KEY" -H 'Content-Type: application/json' \
  -d '{
    "callback_name": "langfuse_otel",
    "callback_type": "success",
    "callback_vars": {
      "langfuse_public_key": "pk-lf-...",
      "langfuse_secret_key": "sk-lf-...",
      "langfuse_span_scope": "llm_only"
    }
  }'
The Admin UI shows the same field as a langfuse span scope pick between full and llm_only next to the Langfuse OTEL credentials of a team or key
Your own Langfuse exporter has a separate switch in the proxy environment:
LITELLM_OTEL_LANGFUSE_SPAN_SCOPE=llm_only # default: full
The two are independent. A tenant's llm_only narrows only that tenant's project, and the operator setting narrows only the exporter built from LANGFUSE_PUBLIC_KEY and LANGFUSE_SECRET_KEY, whichever mode otel_tenant_destination_mode is in. Neither touches a plain otel collector or any other preset, so a Datadog or Grafana view of the same request stays complete. The accepted values are full and llm_only, and a key or team callback with any other value is rejected when it is saved. The setting applies to the langfuse_otel preset only: saving a langfuse_span_scope on a legacy langfuse callback or on another backend's callback is rejected as well, since nothing there would read it
Guardrail and MCP spans are dropped under llm_only, so a guardrail block that failed the request before any model was called leaves nothing in that Langfuse project. Keep full where you rely on Langfuse to see those
Keep Redis and Postgres spans out of tenant traces
A request also produces spans for the proxy's own datastore work: Redis lookups for the auth and response caches, and the Postgres spend write. A key or team that sends traces to its own account receives those as well. Set excluded_services to stop forwarding them to key and team destinations, while the request root, auth, guardrail and model-call spans still go through:
callback_settings:
  otel:
    excluded_services: ["redis", "postgres"]
Or in the proxy environment:
LITELLM_OTEL_EXCLUDED_SERVICES=redis,postgres
The config value wins over the env var when both are set. The accepted names are redis and postgres (postgresql works too), in any case. A span is dropped when its db.system.name, or the older db.system, is one of the listed systems. An unknown name such as auth is logged as an error and ignored; the valid names next to it still apply and the proxy starts normally. With neither set, nothing is dropped
The setting only narrows key and team destinations, meaning a langfuse_otel, arize, weave_otel or newrelic callback set on a team or key as in Set it on a team, from the API or from the team's logging settings in the Admin UI. The tenant needs nothing new. Your own exporters, the otel collector and any preset listed in litellm_settings.callbacks (a proxy-wide langfuse_otel included), keep receiving every span. There is no Admin UI field for excluded_services, since it is a proxy-wide setting
langfuse_span_scope: llm_only already drops these spans for a Langfuse project, together with the request root, auth and guardrail spans. Use excluded_services when the tenant should keep the rest of the request tree
Good to know
The key wins outright over the team. If a key has any metadata.logging entry, the team's callbacks are not consulted at all rather than merged with the key's, so a key that overrides one backend has to restate the others it still wants.
Credentials scope to the exporter their own preset contributed. A request carrying one tenant's Arize key never rewrites the headers of a co-configured Langfuse or self-hosted collector exporter, so a tenant's key cannot leak to a backend it was not meant for. Exporters on backends the tenant did not name do still receive the request's spans, with their own proxy-wide credentials.
The proxy caches one tracer provider per distinct credential set, up to 256 at a time, and flushes the least recently used one when it evicts. Tenant churn costs an exporter rebuild, not a lost span.
os.environ/... references are rejected in key and team callback_vars; pass the resolved value. Field names must be known callback params, and an unknown name fails the whole entry.
This routing applies to traces only. The GenAI client metrics (see Metrics) always go to the proxy-wide exporter.
Distributed tracing
If the incoming request has a W3C traceparent header, LiteLLM continues that trace instead of starting a new one. Your LiteLLM spans then appear inline inside whatever distributed trace your application already has, so you can follow a request from your app, through the proxy, to the LLM provider, in one view.
Configuration reference
All values are environment variables. Boolean flags accept true/false.
| Variable | Default | Purpose |
|---|---|---|
LITELLM_OTEL_V2 | false | Master switch. OTel v2 does nothing until this is true. |
LITELLM_OTEL_TENANT_DESTINATION_MODE | override | additive keeps your own exporter's copy of a request a key or team routed to its own account. |
LITELLM_OTEL_LANGFUSE_SPAN_SCOPE | full | llm_only sends just the model-call spans to your own Langfuse exporter. Tenants set theirs with langfuse_span_scope on the key or team. See Send only the model calls to Langfuse. |
LITELLM_OTEL_EXCLUDED_SERVICES | none | Comma-separated datastores, redis and postgres, whose spans are not forwarded to key and team destinations. callback_settings.otel.excluded_services overrides it. See Keep Redis and Postgres spans out of tenant traces. |
OTEL_EXPORTER (alias OTEL_EXPORTER_OTLP_PROTOCOL) | console | Exporter kind: console, otlp_http, otlp_grpc. |
OTEL_ENDPOINT (alias OTEL_EXPORTER_OTLP_ENDPOINT) | none | OTLP collector URL. Setting an endpoint implies otlp_http unless you override OTEL_EXPORTER. For traces, a callback_settings.otel.exporters list replaces it; see Send to more than one collector. |
OTEL_HEADERS (alias OTEL_EXPORTER_OTLP_HEADERS) | none | Comma-separated key=value auth headers for your backend. |
OTEL_SERVICE_NAME | litellm | service.name resource attribute shown in your backend. |
OTEL_ENVIRONMENT_NAME | none | deployment.environment resource attribute (e.g. production). |
OTEL_INSTRUMENTATION_GENAI_CAPTURE_MESSAGE_CONTENT | no_content | Prompt/response capture: no_content, span_only, event_only, span_and_event. |
OTEL_PYTHON_FASTAPI_EXCLUDED_URLS | health/metrics/UI routes | Comma-separated paths to exclude from tracing (substring match). Set to "" to trace everything. |
LITELLM_OTEL_INTEGRATION_ENABLE_METRICS | false | Also emit the GenAI client metrics (duration, token usage, cost, streaming timings). See Metrics. |
LITELLM_OTEL_LEGACY_COMPAT | true | Also emit attributes under the older Traceloop key names. See Attribute conventions. |
MAPPER_NAMES | genai | Attribute vocabularies written on each span, comma-separated, for example genai,openinference. Also callback_settings.otel.mapper_names in config.yaml. See Attribute conventions and OpenInference tool calls and metadata. |
The full set of keys on each span kind is in Span attributes.
Troubleshooting
No traces showing up?
- Confirm
LITELLM_OTEL_V2=trueis set in the proxy's environment. - Try
OTEL_EXPORTER="console"first. If spans print to stdout, the problem is your exporter endpoint/headers, not LiteLLM. - Make sure you hit an LLM route (e.g.
/v1/chat/completions). Health checks and UI routes are excluded by default. - Check that
opentelemetry-instrumentation-fastapiis installed (see Requirements).
Only see the LLM call but no auth/postgres/server span? Those server and DB spans require the FastAPI instrumentation package, so install opentelemetry-instrumentation-fastapi.
I see metadata but no prompts/responses. That's the default. Set OTEL_INSTRUMENTATION_GENAI_CAPTURE_MESSAGE_CONTENT=span_only to capture content.
Support
For questions, open an issue at BerriAI/litellm.