Maximum Retention Period for Spend Logs
This walks through how to set the maximum retention period for spend logs. This helps manage database size by deleting old logs automatically.
Retention and cleanup are open source. Every setting on this page works without an enterprise license, and the cleanup job does not check license state before it runs.
Requirements
- Postgres (for log storage)
- Redis (optional): required only if you're running multiple proxy instances and want to enable distributed locking
Usage
Setup
Add this to your proxy_config.yaml under general_settings:
general_settings:
  maximum_spend_logs_retention_period: "7d"  # Keep logs for 7 days

  # Optional: prune per-tag daily spend rollups older than this
  maximum_daily_tag_spend_retention_period: "90d"

  # Optional: set how frequently cleanup should run - default is daily
  maximum_spend_logs_retention_interval: "1d"  # Run cleanup daily

  # Optional: also run cleanup a few minutes after every startup - default is false
  maximum_spend_logs_cleanup_run_on_startup: true

  # Optional: set exact time for cleanup (Cron syntax)
  maximum_spend_logs_cleanup_cron: "0 4 * * *" # Run at 04:00 AM daily

  # Optional: bound how much work a single run may do
  maximum_spend_logs_cleanup_batch_size: 1000   # Rows per DELETE statement
  maximum_spend_logs_cleanup_max_batches: 500   # DELETE statements per table per run
  maximum_spend_logs_cleanup_run_budget: "5m"   # Wall clock for the whole run
  maximum_spend_logs_cleanup_batch_timeout: "30s" # statement_timeout and lock_timeout per batch

litellm_settings:
  cache: true
  cache_params:
    type: redis
When the job runs
The cleanup job exists only if you ask for it. It is registered at proxy startup when any of maximum_spend_logs_retention_period, maximum_autorouter_session_retention_period, maximum_health_check_retention_period or maximum_daily_tag_spend_retention_period is set, and not otherwise. Setting one of them later through /config/update registers the job on the next config sync without a restart. With none set, nothing is ever deleted, no matter what the batch, budget, or interval settings say
When a retention period is set and maximum_spend_logs_cleanup_cron is not, the schedule is an interval rather than a time of day. The interval comes from maximum_spend_logs_retention_interval and defaults to 1d, plus a random offset of up to 60 seconds so a fleet of pods does not all fire at the same instant. The first run therefore lands roughly one interval after startup, not at midnight and not at boot. The schedule lives in the process, so a proxy that restarts more often than the interval never reaches its first run. Set maximum_spend_logs_cleanup_run_on_startup: true to also run the cleanup shortly after every startup, or set maximum_spend_logs_cleanup_cron if you want the job pinned to a quiet hour instead.
What gets deleted
A run prunes these tables, each on the cutoff implied by its retention setting:
| Table | Time column | Retention setting |
|---|---|---|
LiteLLM_SpendLogs | startTime | maximum_spend_logs_retention_period |
LiteLLM_SpendLogToolIndex | start_time | maximum_spend_logs_retention_period |
LiteLLM_AutoRouterSession | last_turn_at | maximum_autorouter_session_retention_period |
LiteLLM_HealthCheckTable | checked_at | maximum_health_check_retention_period |
LiteLLM_DailyTagSpend | date | maximum_daily_tag_spend_retention_period |
LiteLLM_SpendLogToolIndex rows are derived from spend logs, so they expire on the same cutoff as the log rows they point at. Auto-router session rollups carry their own retention setting and their own cutoff. Setting only maximum_autorouter_session_retention_period is enough to register the job, in which case spend logs are left untouched and only session rollups are pruned
LiteLLM_DailyTagSpend holds one row per tag, model and calendar day and backs the Tag Usage page. Its date column is a YYYY-MM-DD string, so the cutoff is a day: rows whose day is strictly older than the day the retention period reaches back to are deleted, and the horizon day itself is kept. With maximum_daily_tag_spend_retention_period unset the table is never touched, which is the pre-existing behavior. Tag budgets are enforced from lifetime counters and are unaffected by this pruning, but the Tag Usage chart can no longer show days that were deleted
Configuration Options
maximum_spend_logs_retention_period (required)
How long logs should be kept before deletion. Supported formats:
"7d"– 7 days"24h"– 24 hours"60m"– 60 minutes"3600s"– 3600 seconds
maximum_spend_logs_retention_interval (optional)
How often the cleanup job should run. Uses the same format as above. If not set, cleanup will run every 24 hours if and only if maximum_spend_logs_retention_period is set.
maximum_spend_logs_cleanup_run_on_startup (optional)
Defaults to false. When true, the interval-scheduled cleanup also runs once shortly after every proxy startup, and later runs follow maximum_spend_logs_retention_interval from there. The first run lands SPEND_LOG_CLEANUP_STARTUP_DELAY_SECONDS (default 60) plus a random offset of up to SPEND_LOG_CLEANUP_STARTUP_JITTER_SECONDS (default 300) seconds after startup, so replicas that boot together do not all clean up at the same instant. That delay is capped at the interval, so a short interval never waits longer than it would without the setting. The same first run is scheduled when retention settings change at runtime. Turn it on for deployments that restart more often than the interval, where the cleanup would otherwise never run. It has no effect when maximum_spend_logs_cleanup_cron is set.
maximum_spend_logs_cleanup_cron (optional)
Schedule the cleanup using standard cron syntax. This takes precedence over maximum_spend_logs_retention_interval.
Examples:
"0 4 * * *"– Run at 04:00 AM daily"0 0 * * sun"– Run at midnight every Sunday"*/30 * * * *"– Run every 30 minutes
Use day names (sun, mon, ...) instead of numbers in the weekday field. LiteLLM schedules the cleanup with APScheduler, which numbers weekdays 0=Monday through 6=Sunday, while standard cron uses 0=Sunday through 6=Saturday. Numeric weekday values are not translated between the two conventions, so "0 0 * * 0" fires on Monday, not Sunday. Day names mean the same thing in both conventions and always behave as expected.
The four settings below bound how much work a single run may do. Each one also has an environment variable, which sets that setting's default. The two are not interchangeable: when both are present the general_settings key wins, per key. Anything the duration parser rejects, and anything non-positive, falls back to the default
maximum_spend_logs_cleanup_batch_size (optional)
How many rows each DELETE statement removes. Default is 1000. Environment default: SPEND_LOG_CLEANUP_BATCH_SIZE
maximum_spend_logs_cleanup_max_batches (optional)
How many DELETE statements the job issues per table per run, exactly that many and no more. Default is 500, so at the default batch size a run removes at most 500,000 rows from each table it prunes. Environment default: SPEND_LOG_RUN_LOOPS
maximum_spend_logs_cleanup_run_budget (optional)
Wall-clock budget for the whole run, in the same duration format as the retention period. Default is 5m. The budget covers every table the run touches rather than each table separately, so spend logs draw on it first and whatever is left over goes to the tool index and the session rollups. When the budget is spent the run stops where it is and the remaining backlog waits for the next tick. Environment default: SPEND_LOG_CLEANUP_RUN_BUDGET_SECONDS, expressed in seconds
maximum_spend_logs_cleanup_batch_timeout (optional)
Postgres statement_timeout and lock_timeout applied to each statement the job issues. Default is 30s. A statement that cannot finish, or cannot take its lock, inside this window is cancelled by the database instead of holding a lock while user traffic queues behind it. Environment default: SPEND_LOG_CLEANUP_BATCH_TIMEOUT_SECONDS, expressed in seconds
A cancelled statement counts as a batch failure, and SPEND_LOG_CLEANUP_MAX_CONSECUTIVE_BATCH_FAILURES failures in a row (default 3) abort the run. Set the timeout below the time a batch honestly needs and every batch is cancelled, so the run aborts having deleted nothing and logs Aborting LiteLLM_SpendLogs cleanup after 3 consecutive batch failures; total deleted before abort: 0. If you raise maximum_spend_logs_cleanup_batch_size, check that the timeout still leaves the larger statement room to finish
How it works
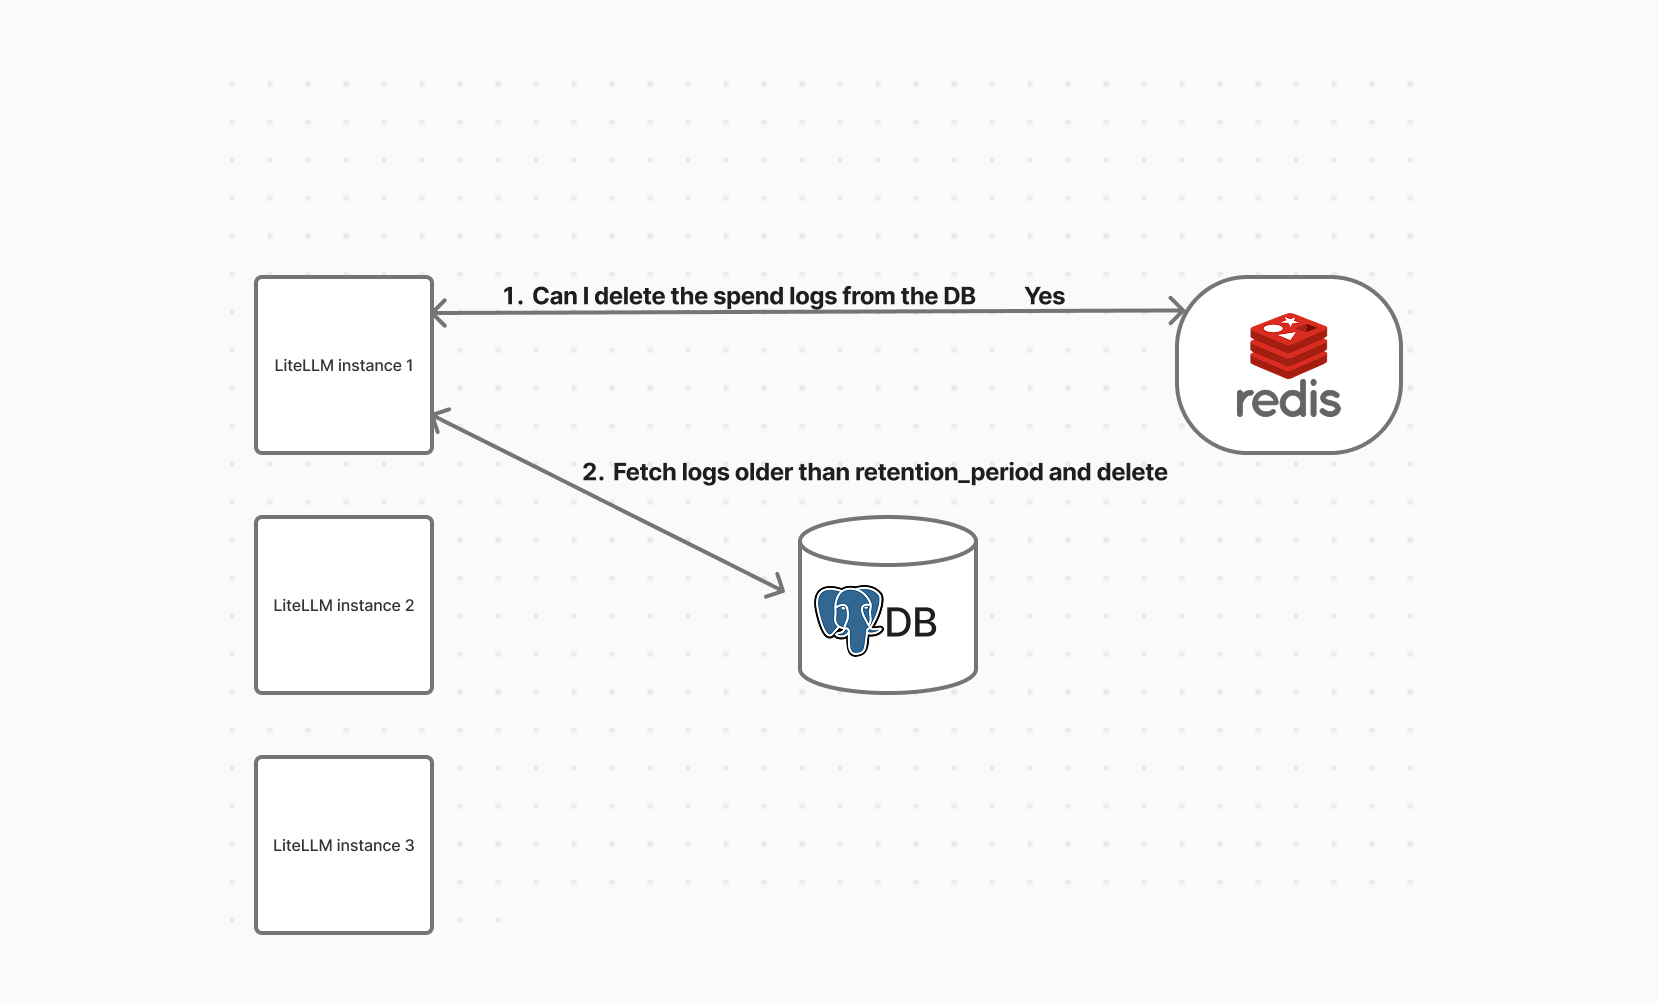
Step 1. Lock Acquisition (Optional with Redis)
If Redis is enabled, LiteLLM uses it to make sure only one instance runs the cleanup at a time.
- If the lock is acquired:
- This instance proceeds with cleanup
- Others skip it
- If no lock is present:
- Cleanup still runs (useful for single-node setups)
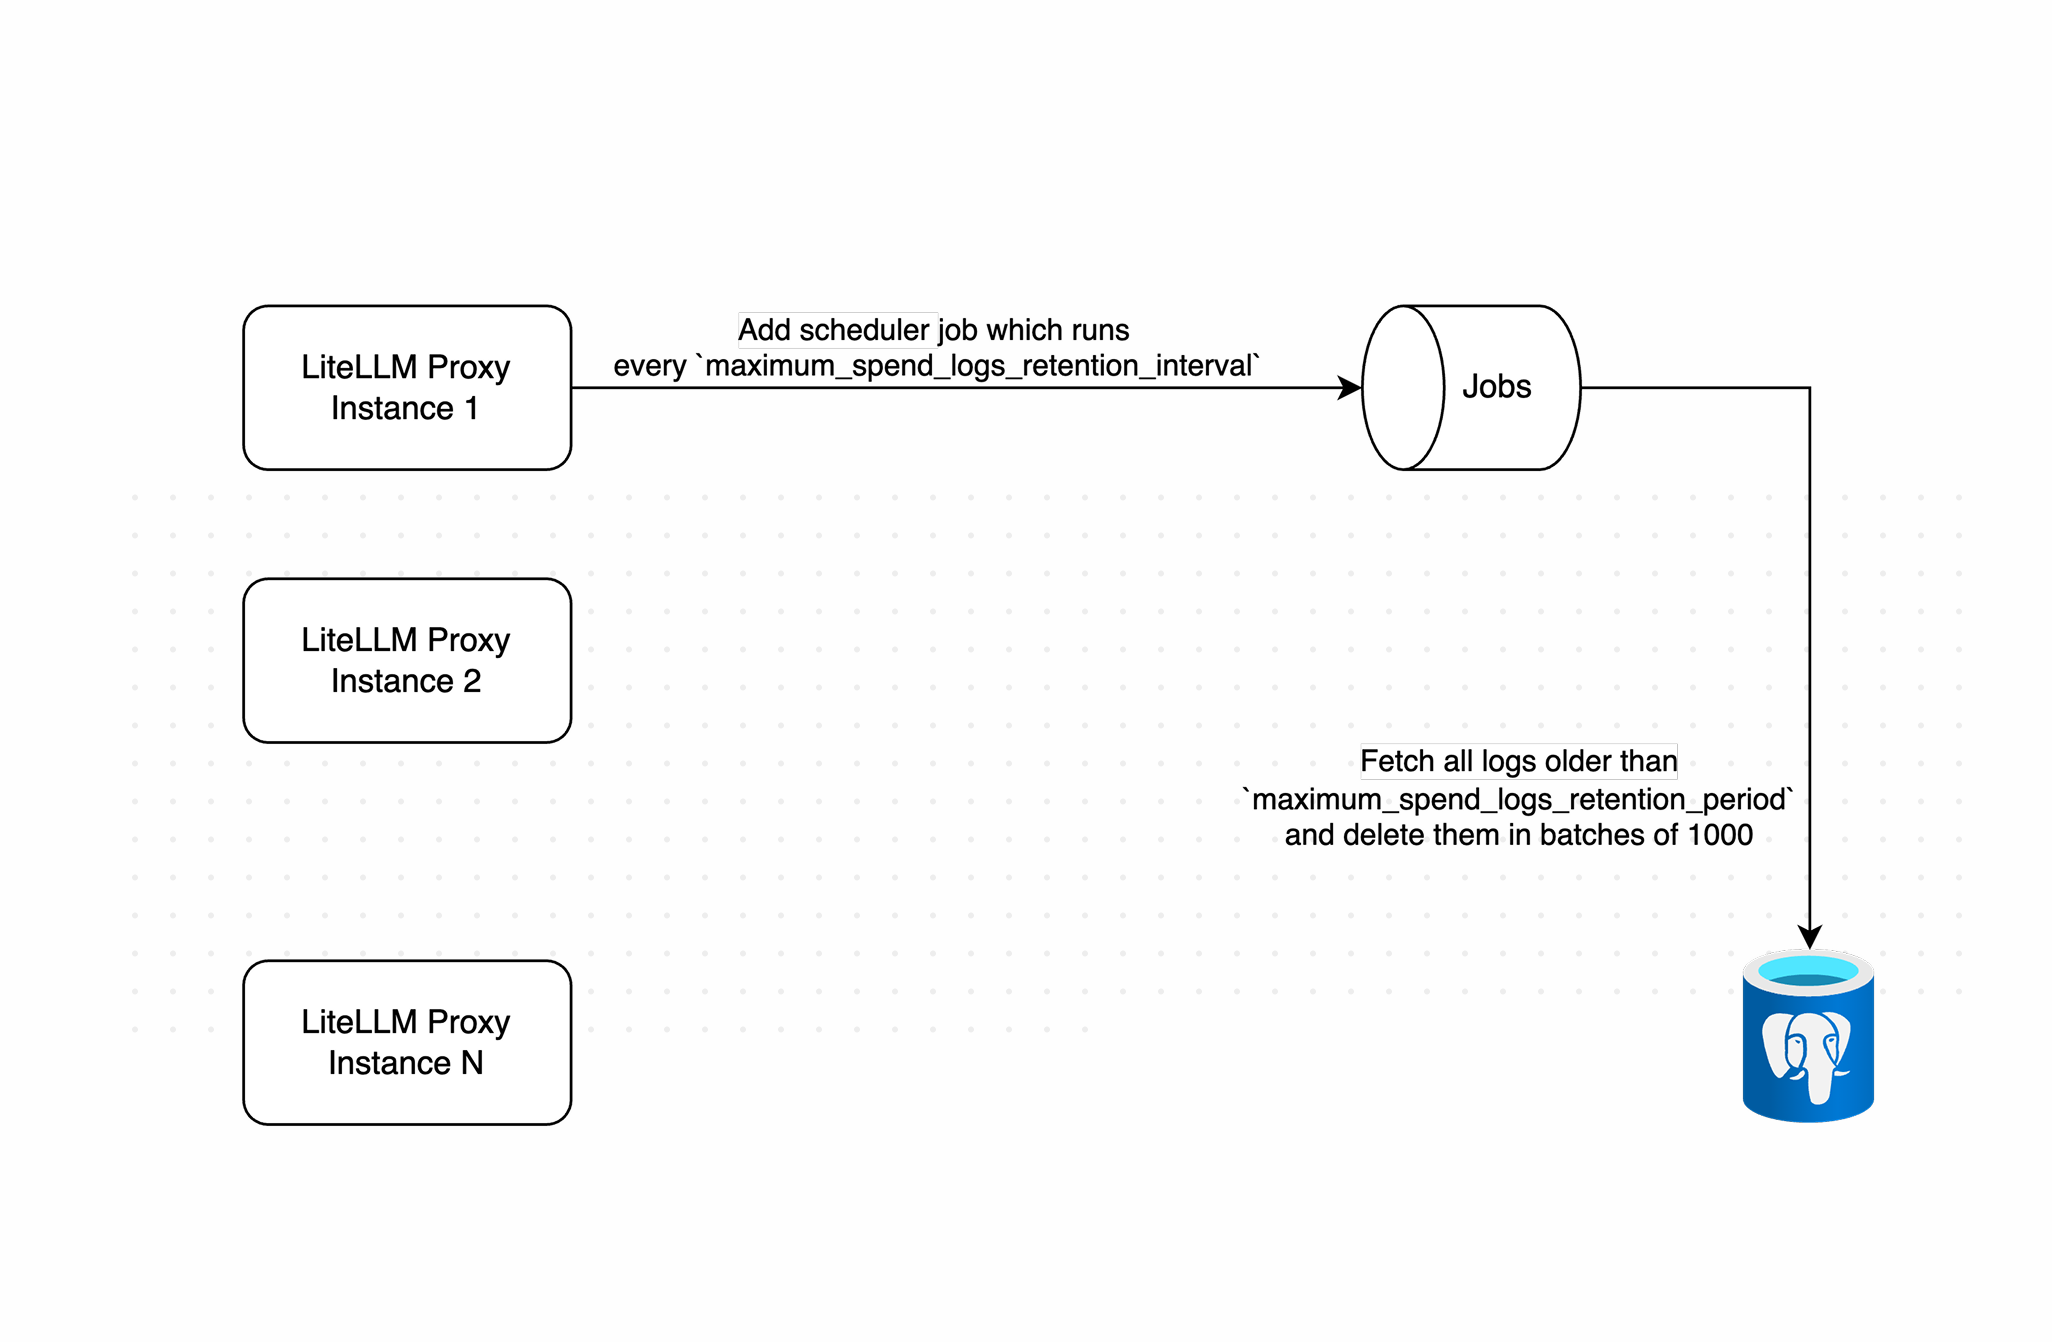
Working of spend log deletions
Step 2. Batch Deletion
Once cleanup starts:
- It calculates the cutoff date using the configured retention period
- Deletes logs older than the cutoff in batches (default size
1000) - Adds a short delay between batches to avoid overloading the database
Batch deletion of old logs
Step 3. Bounds
Left unbounded, a single run against a large table is a long stream of heavy write transactions that can saturate the database it is cleaning. Every run is bounded three ways at once and stops at whichever bound it reaches first: maximum_spend_logs_cleanup_batch_size rows per DELETE (default 1000), maximum_spend_logs_cleanup_max_batches statements per table (default 500), and maximum_spend_logs_cleanup_run_budget of wall clock for the run as a whole (default 5m). At the defaults that comes to at most 500,000 rows per table and at most five minutes of work
The budget is checked between statements, so it decides when the job stops issuing new work. What bounds a statement already in flight is maximum_spend_logs_cleanup_batch_timeout, applied as the Postgres statement_timeout and lock_timeout on every statement the job issues, the outstanding-rows probe included. The honest consequence of checking between statements is that a run can overrun its budget by at most one batch timeout, so size the budget knowing the real ceiling is the budget plus one timeout. Stopping early is expected. The run resumes from the same cutoff on the next tick, so a backlog drains across several runs
Each bound has an environment variable that sets its default, listed below with the two failure-handling knobs. Where a general_settings key exists for the same bound, that key overrides the environment default:
| Environment variable | Default | Description |
|---|---|---|
SPEND_LOG_CLEANUP_BATCH_SIZE | 1000 | Rows deleted per DELETE statement |
SPEND_LOG_RUN_LOOPS | 500 | Maximum DELETE statements per table per run |
SPEND_LOG_CLEANUP_RUN_BUDGET_SECONDS | 300 | Wall-clock budget in seconds for the whole run, shared across every table it cleans |
SPEND_LOG_CLEANUP_BATCH_TIMEOUT_SECONDS | 30 | Postgres statement_timeout and lock_timeout in seconds for every statement the job issues |
SPEND_LOG_CLEANUP_REMAINING_COUNT_CAP | 100000 | Upper bound on the outstanding-rows probe, so reporting the backlog cannot itself become an expensive scan |
SPEND_LOG_CLEANUP_MAX_CONSECUTIVE_BATCH_FAILURES | 3 | Consecutive batch failures tolerated before the run aborts |
SPEND_LOG_CLEANUP_BATCH_FAILURE_BACKOFF_SECONDS | 0.5 | Pause after a failed batch before retrying |
Metrics
The job reports what it did through Prometheus, so you can tell a healthy steady state from a backlog that keeps growing. Every metric is labelled by table except the last, which is labelled by outcome:
| Metric | What it tells you |
|---|---|
litellm_spend_log_cleanup_rows_deleted_total | Rows removed, per table |
litellm_spend_log_cleanup_batch_duration_seconds | How long individual batches take, which is what you watch when tuning batch size |
litellm_spend_log_cleanup_rows_remaining | Expired rows still waiting after the run |
litellm_spend_log_cleanup_batch_failures_total | Failed batches, including statements cancelled by the batch timeout |
litellm_spend_log_cleanup_runs_total | Runs by outcome: completed, budget_exhausted, batch_cap_reached, skipped_locked, skipped_disabled, or aborted |
rows_remaining is the one to alert on. Flat or near zero means retention is keeping up, and a rising line means it is not. Read it together with runs_total: a healthy deployment sits at completed, while a steady stream of budget_exhausted or batch_cap_reached says the run is being cut short every tick and the knobs need raising
The probe behind rows_remaining is bounded by SPEND_LOG_CLEANUP_REMAINING_COUNT_CAP (default 100000). It stops counting at the cap so that reporting the backlog never itself becomes a full scan of a large table, which means a table with more expired rows than the cap reports exactly the cap. Treat the value as a floor once it sits at 100000
Large tables
Indexing
LiteLLM_SpendLogs ships with indexes on startTime and on (startTime, request_id), which is what the delete batch needs, so there is nothing to add for retention on a default schema. On a seeded 2,000,000-row table the per-batch plan is an index scan on LiteLLM_SpendLogs_startTime_idx feeding a nested loop, about 1.8 ms for a 1000-row batch
So the batch itself is cheap, and a slow run is rarely a sign of a bad plan. What a large backlog actually costs you is WAL volume and the autovacuum load created by the dead tuples the deletes leave behind. On that same table, a run that removed roughly 500,000 rows in 111 seconds left around 1,000,000 dead tuples across the spend log and tool index tables, which is enough to keep autovacuum busy on both of them well after the run finished. Tune for that, not for the delete plan
Sizing the knobs
Batch size trades lock duration and WAL record size against throughput. Bigger batches delete more rows per statement and spend proportionally less time in the fixed pause between batches, at the cost of holding row locks longer and giving maximum_spend_logs_cleanup_batch_timeout less headroom. Max batches caps how much a single run can ever delete from one table, and the run budget caps how long the whole run may hold the database's attention regardless of how the other two are set
The pause between batches, a fixed 0.1s, dominates the per-batch cost at the default batch size, which puts throughput near 10,000 rows per second and makes the 500-batch cap, not the five-minute budget, the binding limit at defaults
Take a deployment ingesting 5,000,000 spend log rows a day with 30 day retention. In steady state each daily run has to delete about a day of rows, so the default cap of 500,000 leaves retention permanently behind and the table grows without bound. Raising maximum_spend_logs_cleanup_batch_size to 5000 and maximum_spend_logs_cleanup_max_batches to 2000 lifts the ceiling to 10,000,000 rows and takes the run to roughly 110 seconds for 5,000,000 rows, comfortably inside the default 5m budget, with each statement still finishing far inside the 30s batch timeout. Check litellm_spend_log_cleanup_rows_remaining after a few days: if it trends flat you are keeping up, and if it climbs run the cleanup more often with maximum_spend_logs_retention_interval rather than making batches larger still
Draining a large backlog
Turning retention on for the first time against a table that already holds months of history is the case worth planning. A run stops at its budget and picks up from the same cutoff on the next tick, so the backlog does drain on its own, just over many runs. Left at the defaults with a daily interval, a 100,000,000-row backlog would take months
To drain it faster, raise maximum_spend_logs_cleanup_run_budget and maximum_spend_logs_cleanup_max_batches during a maintenance window, watch replication lag and autovacuum on the spend log tables while it runs, then put both back to their defaults. Draining in a window you control is much easier to reason about than discovering the same work in the middle of a peak hour
If the table is large because volume is genuinely high, rather than because retention was off, converting it to a partitioned table is the better answer. Retention then drops whole partitions instead of deleting rows, which frees disk immediately and leaves no dead tuples to vacuum, and none of the batch or budget knobs matter for the data that a partition drop reclaims. See below
Partitioning for high-volume deployments
At high request volume (millions of rows per day), retention via DELETE becomes a problem. Deleting rows does not return disk to the operating system; it leaves dead tuples ("tombstones") that autovacuum has to reclaim later. When writes outpace autovacuum, the table keeps growing on disk even though the logical row count is bounded, and LiteLLM_SpendLogs can reach hundreds of GB in a month.
The fix is native Postgres range partitioning on startTime. With a partitioned table, retention drops whole partitions with DROP TABLE, an instant metadata operation that frees disk immediately, with no tombstones and no vacuum. With general_settings.use_spend_logs_partitioning: true set and the table actually partitioned, the same cleanup job switches from batched deletes to dropping expired partitions, and it pre-creates upcoming partitions on each run so writes always have a partition to land in; both conditions are required, detection alone does not flip the behavior.
This is opt-in. The default schema is not partitioned, so existing deployments are unaffected until you convert the table.
Partition maintenance interacts with the run budget in one way worth knowing. The job only starts partition maintenance while the run still has budget left, and a run that is already over skips it until the next tick. Once a drop is running the budget cannot cut it short, because dropping a partition is DDL that holds an ACCESS EXCLUSIVE lock and has to run to completion. Everything else the job does is interruptible between statements, so this is the single piece of work a budget cannot bound mid-flight
Converting the table
Partitioning a populated table cannot be done in place, so the conversion renames the existing table aside and creates a fresh partitioned table. The partition key must be part of the primary key, so the primary key becomes the composite ("request_id", "startTime"); LiteLLM's spend-log write path uses INSERT ... ON CONFLICT DO NOTHING, which is compatible with this.
Run the runbook in db_scripts/partition_spend_logs.sql against your database (test on a staging copy and take a backup first). It creates the partitioned parent, the composite primary key, the startTime index, and a DEFAULT partition as a safety net for any out-of-range rows.
After converting, set a retention period as shown above and the cleanup job manages partitions for you.
Tuning
| Environment variable | Default | Description |
|---|---|---|
SPEND_LOG_PARTITION_INTERVAL | day | Partition granularity: day, week, or month. Use day for high-volume tables so retention is precise and individual partitions stay manageable. |
SPEND_LOG_PARTITION_PRECREATE_AHEAD | 7 | How many future partitions to pre-create on each cleanup run. |
A partition is only dropped once its entire time range is older than the retention cutoff, so effective retention is rounded up to the partition granularity.