Alerting / Webhooks
For findings in the Admin UI, see model deprecation alerts and performance alerts. This page covers notifications sent to external services.
Get alerts for:
| Category | Alert Type |
|---|---|
| LLM Performance | Hanging API calls, Slow API calls, Failed API calls, Model outage alerting |
| Budget & Spend | Budget tracking per key/user, Soft budget alerts, Weekly & Monthly spend reports per Team/Tag |
| System Health | Failed database read/writes |
| Daily Reports | Top 5 slowest LLM deployments, Top 5 LLM deployments with most failed requests, Weekly & Monthly spend per Team/Tag |
Works across:
Quick Start
Set up a slack alert channel to receive alerts from proxy.
Step 1: Add a Slack Webhook URL to env
Get a slack webhook url from https://api.slack.com/messaging/webhooks
You can also use Discord Webhooks, see here
Set SLACK_WEBHOOK_URL in your proxy env to enable Slack alerts.
export SLACK_WEBHOOK_URL="https://hooks.slack.com/services/<>/<>/<>"
If SLACK_WEBHOOK_URL is unset, ALERTING_WEBHOOK_URL is read as a provider-neutral fallback. Use it to send the same Slack-format alerts to any Slack-compatible incoming webhook, such as Rocket.Chat or Mattermost
Step 2: Setup Proxy
general_settings:
    alerting: ["slack"]
    alerting_threshold: 300 # sends alerts if requests hang for 5min+ and responses take 5min+
    spend_report_frequency: "1d" # [Optional] set as 1d, 2d, 30d .... Specify how often you want a Spend Report to be sent

    # [OPTIONAL ALERTING ARGS]
    alerting_args:
        daily_report_frequency: 43200  # 12 hours in seconds
        report_check_interval: 300     # 5 minutes in seconds
        budget_alert_ttl: 86400        # 24 hours in seconds
        outage_alert_ttl: 60           # 1 minute in seconds
        region_outage_alert_ttl: 60    # 1 minute in seconds
        minor_outage_alert_threshold: 5
        major_outage_alert_threshold: 10
        max_outage_alert_list_size: 10
        log_to_console: false
Start proxy
$ litellm --config /path/to/config.yaml
Step 3: Test it!
curl -X GET 'http://0.0.0.0:4000/health/services?service=slack' \
-H "Authorization: Bearer $LITELLM_API_KEY"
Advanced
Route actionable alerts
Give each alert an owner and a response. Route database failures and sustained provider outages to gateway operators. Route budgets and spend reports to the cost owner. Keep individual slow calls in a diagnostic channel; page from a monitoring rule tied to your latency or error target. Compare Flex latency with that workload's deadline before treating it as an incident.
Monitor gateway availability and missing metrics externally. A stopped or blocked gateway cannot reliably send its own outage alert.
This example selects five alert types and routes them to separate Slack incoming webhooks. Store the URLs in environment variables and merge the fragment with your existing configuration:
general_settings:
  alerting: [slack]
  alert_types: [db_exceptions, outage_alerts, llm_too_slow, budget_alerts, spend_reports]
  alert_to_webhook_url:
    db_exceptions: os.environ/SLACK_OPERATIONS_WEBHOOK_URL
    outage_alerts: os.environ/SLACK_OPERATIONS_WEBHOOK_URL
    llm_too_slow: os.environ/SLACK_DIAGNOSTICS_WEBHOOK_URL
    budget_alerts: os.environ/SLACK_BUDGET_WEBHOOK_URL
    spend_reports: os.environ/SLACK_BUDGET_WEBHOOK_URL
  alert_type_config:
    llm_too_slow:
      digest: true
      digest_interval: 300

litellm_settings:
  redact_messages_in_exceptions: true
alert_types is an allowlist: other types are excluded. Review the full list before applying it. An enabled type without a mapping uses the default webhook, from SLACK_WEBHOOK_URL or its fallback ALERTING_WEBHOOK_URL. Each mapped environment variable must resolve to a webhook URL.
Keep urgent types such as db_exceptions out of digest mode. A digest delays delivery, retains the first message and an event count for each group, and lives in each proxy process's memory. Restarts can lose pending events, and several workers or pods can send separate summaries. Use your monitoring system for durable aggregation and concise incident pages. These routing settings do not customize alert text. The mapping and digest settings apply to Slack; Teams uses its own destination and sends individual alerts.
Add cooldown notifications to diagnostics when useful. fallback_reports is a scheduled report from Prometheus, not a notification for each fallback; it requires a configured PROMETHEUS_URL and collected fallback metrics.
In staging, trigger the selected events and check their destinations. Confirm that repeated slow calls produce a digest, while urgent events have no digest delay. Inspect payloads for sensitive metadata. See L7 proxy with LiteLLM and Security Best Practices for deployment and security checks.
Redacting Messages from Alerts
By default alerts show the messages/input passed to the LLM. If you want to redact this from slack alerting set the following setting on your config
general_settings:
  alerting: ["slack"]
  alert_types: ["spend_reports"]

litellm_settings:
  redact_messages_in_exceptions: True
Soft Budget Alerts for Virtual Keys
Use this to send an alert when a key/team is close to it's budget running out
Step 1. Create a virtual key with a soft budget
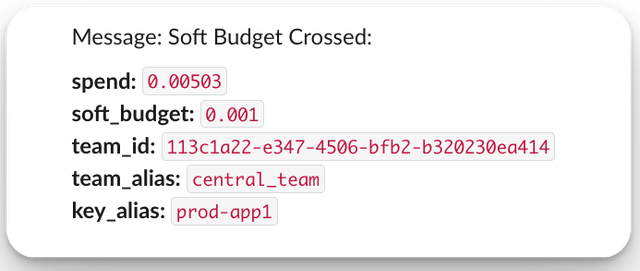
Set the soft_budget to 0.001
curl -X 'POST' \
  'http://localhost:4000/key/generate' \
  -H 'accept: application/json' \
  -H 'x-goog-api-key: sk-<your-litellm-api-key>' \
  -H 'Content-Type: application/json' \
  -d '{
  "key_alias": "prod-app1",
  "team_id": "113c1a22-e347-4506-bfb2-b320230ea414",
  "soft_budget": 0.001
}'
Step 2. Send a request to the proxy with the virtual key
curl http://0.0.0.0:4000/chat/completions \
-H "Content-Type: application/json" \
-H "Authorization: Bearer sk-Nb5eCf427iewOlbxXIH4Ow" \
-d '{
  "model": "openai/gpt-6.1-sol",
  "messages": [
    {
      "role": "user",
      "content": "this is a test request, write a short poem"
    }
  ]
}'
Step 3. Check slack for Expected Alert
Add Metadata to alerts
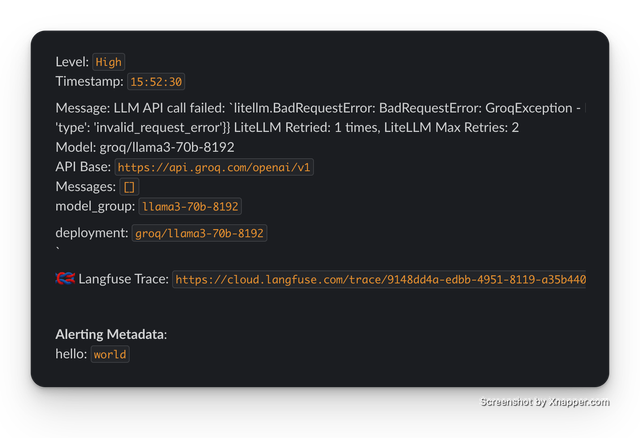
Add alerting metadata to proxy calls for debugging.
import openai
client = openai.OpenAI(
    api_key="anything",
    base_url="http://0.0.0.0:4000"
)

# request sent to model set on litellm proxy, `litellm --model`
response = client.chat.completions.create(
    model="gpt-6.1-sol",
    messages = [],
    extra_body={
        "metadata": {
            "alerting_metadata": {
                "hello": "world"
            }
        }
    }
)
Expected Response
Select specific alert types
Set alert_types if you want to Opt into only specific alert types. When alert_types is not set, all Default Alert Types are enabled.
general_settings:
  alerting: ["slack"]
  alert_types: [
    "llm_exceptions",
    "llm_too_slow",
    "llm_requests_hanging",
    "budget_alerts",
    "spend_reports",
    "db_exceptions",
    "daily_reports",
    "cooldown_deployment",
    "new_model_added",
  ]
Map slack channels to alert type
Use this if you want to set specific channels per alert type
This allows you to do the following
llm_exceptions -> go to slack channel #llm-exceptions
spend_reports -> go to slack channel #llm-spend-reports
Set alert_to_webhook_url on your config.yaml
- 1 channel per alert
- multiple channels per alert
model_list:
  - model_name: gpt-6.1-sol
    litellm_params:
      model: openai/fake
      api_key: fake-key
      api_base: https://exampleopenaiendpoint-production.up.railway.app/

general_settings:
  master_key: os.environ/LITELLM_MASTER_KEY
  alerting: ["slack"]
  alerting_threshold: 0.0001 # (Seconds) set an artificially low threshold for testing alerting
  alert_to_webhook_url: {
    "llm_exceptions": "example-slack-webhook-url",
    "llm_too_slow": "example-slack-webhook-url",
    "llm_requests_hanging": "example-slack-webhook-url",
    "budget_alerts": "example-slack-webhook-url",
    "db_exceptions": "example-slack-webhook-url",
    "daily_reports": "example-slack-webhook-url",
    "spend_reports": "example-slack-webhook-url",
    "cooldown_deployment": "example-slack-webhook-url",
    "new_model_added": "example-slack-webhook-url",
    "outage_alerts": "example-slack-webhook-url",
  }

litellm_settings:
  success_callback: ["langfuse"]
Provide multiple slack channels for a given alert type
model_list:
  - model_name: gpt-6.1-sol
    litellm_params:
      model: openai/fake
      api_key: fake-key
      api_base: https://exampleopenaiendpoint-production.up.railway.app/

general_settings:
  master_key: os.environ/LITELLM_MASTER_KEY
  alerting: ["slack"]
  alerting_threshold: 0.0001 # (Seconds) set an artificially low threshold for testing alerting
  alert_to_webhook_url: {
    "llm_exceptions": ["os.environ/SLACK_WEBHOOK_URL", "os.environ/SLACK_WEBHOOK_URL_2"],
    "llm_too_slow": ["https://webhook.site/7843a980-a494-4967-80fb-d502dbc16886", "https://webhook.site/28cfb179-f4fb-4408-8129-729ff55cf213"],
    "llm_requests_hanging": ["os.environ/SLACK_WEBHOOK_URL_5", "os.environ/SLACK_WEBHOOK_URL_6"],
    "budget_alerts": ["os.environ/SLACK_WEBHOOK_URL_7", "os.environ/SLACK_WEBHOOK_URL_8"],
    "db_exceptions": ["os.environ/SLACK_WEBHOOK_URL_9", "os.environ/SLACK_WEBHOOK_URL_10"],
    "daily_reports": ["os.environ/SLACK_WEBHOOK_URL_11", "os.environ/SLACK_WEBHOOK_URL_12"],
    "spend_reports": ["os.environ/SLACK_WEBHOOK_URL_13", "os.environ/SLACK_WEBHOOK_URL_14"],
    "cooldown_deployment": ["os.environ/SLACK_WEBHOOK_URL_15", "os.environ/SLACK_WEBHOOK_URL_16"],
    "new_model_added": ["os.environ/SLACK_WEBHOOK_URL_17", "os.environ/SLACK_WEBHOOK_URL_18"],
    "outage_alerts": ["os.environ/SLACK_WEBHOOK_URL_19", "os.environ/SLACK_WEBHOOK_URL_20"],
  }

litellm_settings:
  success_callback: ["langfuse"]
Test it - send a valid llm request - expect to see a llm_too_slow alert in it's own slack channel
curl -i http://localhost:4000/v1/chat/completions \
  -H "Content-Type: application/json" \
  -H "Authorization: Bearer $LITELLM_API_KEY" \
  -d '{
    "model": "gpt-6.1-sol",
    "messages": [
      {"role": "user", "content": "Hello, Claude gm!"}
    ]
}'
MS Teams Webhooks
Since v1.100.0LiteLLM sends alerts to Microsoft Teams natively through the ms_teams alerting destination. Each alert is posted as an Adaptive Card, which both Teams Workflows webhooks and legacy incoming webhook connectors accept
Quick Start
-
Create an incoming webhook for your Microsoft Teams channel
-
Add it to your .env
MS_TEAMS_WEBHOOK_URL="https://<your-tenant>.webhook.office.com/webhookb2/<...>/IncomingWebhook/<...>"
- Add
ms_teamstoalertingin your litellm config. It can sit alongside other destinations such asslackoremail
model_list:
    model_name: "azure-model"
    litellm_params:
        model: "azure/gpt-6-luna"
        api_key: "my-bad-key" # bad key

general_settings:
    alerting: ["ms_teams"]
    alerting_threshold: 300 # sends alerts if requests hang for 5min+ and responses take 5min+
- Run health check!
Call the proxy /health/services endpoint with service=ms_teams to send a test alert to your channel
curl --location 'http://0.0.0.0:4000/health/services?service=ms_teams' \
--header "Authorization: Bearer $LITELLM_API_KEY"
Expected Response
{
  "status": "success",
  "message": "Mock MS Teams Alert sent, verify MS Teams Alert Received in your channel"
}
You can also set the webhook URL from the Admin UI on the Logging & Alerts page under the MS Teams Alerts tab, which saves MS_TEAMS_WEBHOOK_URL and adds ms_teams to alerting for you
alert_types applies to Teams the same way it applies to Slack. alert_to_webhook_url and digest mode only route Slack alerts; Teams alerts always go to MS_TEAMS_WEBHOOK_URL and are sent individually rather than digested
Discord Webhooks
Discord provides a slack compatible webhook url that you can use for alerting
Quick Start
-
Get a webhook url for your discord channel
-
Append
/slackto your discord webhook - it should look like
"https://discord.com/api/webhooks/1240030362193760286/cTLWt5ATn1gKmcy_982rl5xmYHsrM1IWJdmCL1AyOmU9JdQXazrp8L1_PYgUtgxj8x4f/slack"
- Add it to your litellm config
model_list:
    model_name: "azure-model"
    litellm_params:
        model: "azure/gpt-6-luna"
        api_key: "my-bad-key" # bad key

general_settings:
    alerting: ["slack"]
    alerting_threshold: 300 # sends alerts if requests hang for 5min+ and responses take 5min+

environment_variables:
    SLACK_WEBHOOK_URL: "https://discord.com/api/webhooks/1240030362193760286/cTLWt5ATn1gKmcy_982rl5xmYHsrM1IWJdmCL1AyOmU9JdQXazrp8L1_PYgUtgxj8x4f/slack"
[BETA] Webhooks for Budget Alerts
Note: This is a beta feature, so the spec might change.
Set a webhook to get notified for budget alerts.
- Setup config.yaml
Add url to your environment, for testing you can use a link from here
export WEBHOOK_URL="https://webhook.site/6ab090e8-c55f-4a23-b075-3209f5c57906"
Add 'webhook' to config.yaml
general_settings:
  alerting: ["webhook"] # KEY CHANGE
- Start proxy
litellm --config /path/to/config.yaml

# RUNNING on http://0.0.0.0:4000
- Test it!
curl -X GET --location 'http://0.0.0.0:4000/health/services?service=webhook' \
--header "Authorization: Bearer $LITELLM_API_KEY"
Expected Response
{
  "spend": 1, # the spend for the 'event_group'
  "max_budget": 0, # the 'max_budget' set for the 'event_group'
  "token": "example-api-key-123",
  "user_id": "default_user_id",
  "team_id": null,
  "user_email": null,
  "key_alias": null,
  "projected_exceeded_date": null,
  "projected_spend": null,
  "event": "budget_crossed", # see the `event` spec below for all values
  "event_group": "user",
  "event_message": "User Budget: Budget Crossed"
}
API Spec for Webhook Event
-
spendfloat: The current spend amount for the 'event_group'. -
max_budgetfloat or null: The maximum allowed budget for the 'event_group'. null if not set. -
soft_budgetfloat or null: The soft budget set for the 'event_group'. null if not set. -
tokenstr: A hashed value of the key, used for authentication or identification purposes. -
customer_idstr or null: The ID of the customer associated with the event (optional). -
user_idstr or null: The ID of the internal user associated with the event (optional). -
team_idstr or null: The ID of the team associated with the event (optional). -
team_aliasstr or null: The alias of the team associated with the event (optional). -
organization_idstr or null: The ID of the organization associated with the event (optional). -
user_emailstr or null: The email of the internal user associated with the event (optional). -
key_aliasstr or null: An alias for the key associated with the event (optional). -
projected_exceeded_datestr or null: The date when the budget is projected to be exceeded, returned when 'soft_budget' is set for key (optional). -
projected_spendfloat or null: The projected spend amount, returned when 'soft_budget' is set for key (optional). -
eventLiteral["budget_crossed", "max_budget_alert", "soft_budget_crossed", "threshold_crossed", "projected_limit_exceeded", "key_created", "key_rotated", "internal_user_created", "spend_tracked"]: The type of event that triggered the webhook.key_created,key_rotated,internal_user_createdandmax_budget_alertare shared with email alerts. Budget webhook values are:- "spend_tracked": Emitted whenever spend is tracked for a customer id.
- "budget_crossed": Indicates that the spend has exceeded the max budget.
- "soft_budget_crossed": Indicates that the spend has exceeded the soft budget.
- "threshold_crossed": Indicates that spend has crossed a threshold (currently sent when 85% and 95% of budget is reached).
- "projected_limit_exceeded": For "key" only - Indicates that the projected spend is expected to exceed the soft budget threshold.
-
event_groupLiteral["customer", "internal_user", "key", "team", "proxy"]: The group associated with the event. Possible values are:- "customer": The event is related to a specific customer
- "internal_user": The event is related to a specific internal user.
- "key": The event is related to a specific key.
- "team": The event is related to a team.
- "proxy": The event is related to a proxy.
-
event_messagestr: A human-readable description of the event.
Digest Mode (Reducing Alert Noise)
By default, LiteLLM sends a separate Slack message for every alert event. For high-frequency alert types like llm_requests_hanging or llm_too_slow, this can produce hundreds of duplicate messages per day.
Digest mode aggregates duplicate alerts within a configurable time window and emits a single summary message with the total count and time range.
Configuration
Use alert_type_config in general_settings to enable digest mode per alert type:
general_settings:
  alerting: ["slack"]
  alert_type_config:
    llm_requests_hanging:
      digest: true
      digest_interval: 86400  # 24 hours (default)
    llm_too_slow:
      digest: true
      digest_interval: 3600   # 1 hour
    llm_exceptions:
      digest: true
      # uses default interval (86400 seconds / 24 hours)
| Parameter | Type | Default | Description |
|---|---|---|---|
digest | bool | false | Enable digest mode for this alert type |
digest_interval | int | 86400 (24h) | Time window in seconds. Alerts are aggregated within this interval. |
How It Works
- When an alert fires for a digest-enabled type, it is grouped by
(alert_type, request_model, api_base)instead of being sent immediately - A counter tracks how many times the alert fires within the interval
- When the interval expires, a single summary message is sent:
Alert type: `llm_requests_hanging` (Digest)
Level: `Medium`
Start: `2026-02-19 03:27:39`
End: `2026-02-20 03:27:39`
Count: `847`

Message: `Requests are hanging - 600s+ request time`
Request Model: `gemini-3.8-flash`
API Base: `None`
Limitations
- Per-instance: Digest state is held in memory per proxy instance. If you run multiple instances (e.g., Cloud Run with autoscaling), each instance maintains its own digest and emits its own summary.
- Not durable: If an instance is terminated before the digest interval expires, the aggregated alerts for that instance are lost.
Region-outage alerting (Enterprise feature)
Setup alerts if a provider region is having an outage.
general_settings:
    alerting: ["slack"]
    alert_types: ["region_outage_alerts"]
By default this will trigger if multiple models in a region fail 5+ requests in 1 minute. '400' status code errors are not counted (i.e. BadRequestErrors).
Control thresholds with:
general_settings:
    alerting: ["slack"]
    alert_types: ["region_outage_alerts"]
    alerting_args:
        region_outage_alert_ttl: 60 # time-window in seconds
        minor_outage_alert_threshold: 5 # number of errors to trigger a minor alert
        major_outage_alert_threshold: 10 # number of errors to trigger a major alert
All Possible Alert Types
Here is how you can set specific alert types
LLM-related Alerts
| Alert Type | Description | Default On |
|---|---|---|
llm_exceptions | Alerts for LLM API exceptions | ✅ |
llm_too_slow | Notifications for LLM responses slower than the set threshold | ✅ |
llm_requests_hanging | Alerts for LLM requests that are not completing | ✅ |
cooldown_deployment | Alerts when a deployment is put into cooldown | ✅ |
new_model_added | Notifications when a new model is added to litellm proxy through /model/new | ✅ |
outage_alerts | Alerts when a specific LLM deployment is facing an outage | ✅ |
region_outage_alerts | Alerts when a specific LLM region is facing an outage. Example us-east-1 | ✅ |
Budget and Spend Alerts
| Alert Type | Description | Default On |
|---|---|---|
budget_alerts | Notifications related to budget limits or thresholds | ✅ |
spend_reports | Periodic reports on spending across teams or tags | ✅ |
failed_tracking_spend | Alerts when spend tracking fails | ✅ |
daily_reports | Daily Spend reports | ✅ |
fallback_reports | Weekly Reports on LLM fallback occurrences | ✅ |
Database Alerts
| Alert Type | Description | Default On |
|---|---|---|
db_exceptions | Notifications for database-related exceptions | ✅ |
MCP Gateway Alerts
| Alert Type | Description | Default On |
|---|---|---|
mcp_tool_description_blocked | A pre_mcp_call guardrail blocked an upstream MCP tool's description, so the tool was hidden from tools/list. See MCP Guardrails | ✅ |
mcp_pinned_tools_changed | A pinned MCP server's upstream tool list, descriptions, or input schemas drifted from the pin. See Pin a Server's Tool List | ✅ |
Management Endpoint Alerts - Virtual Key, Team, Internal User
| Alert Type | Description | Default On |
|---|---|---|
new_virtual_key_created | Notifications when a new virtual key is created | ❌ |
virtual_key_updated | Alerts when a virtual key is modified | ❌ |
virtual_key_deleted | Notifications when a virtual key is removed | ❌ |
new_team_created | Alerts for the creation of a new team | ❌ |
team_updated | Notifications when team details are modified | ❌ |
team_deleted | Alerts when a team is deleted | ❌ |
new_internal_user_created | Notifications for new internal user accounts | ❌ |
internal_user_updated | Alerts when an internal user's details are changed | ❌ |
internal_user_deleted | Notifications when an internal user account is removed | ❌ |
alerting_args Specification
| Parameter | Default | Description |
|---|---|---|
daily_report_frequency | 43200 (12 hours) | Frequency of receiving deployment latency/failure reports in seconds |
report_check_interval | 300 (5 minutes) | How often to check if a report should be sent (background process) in seconds |
budget_alert_ttl | 86400 (24 hours) | Cache TTL for budget alerts to prevent spam when budget is crossed |
outage_alert_ttl | 60 (1 minute) | Time window for collecting model outage errors in seconds |
region_outage_alert_ttl | 60 (1 minute) | Time window for collecting region-based outage errors in seconds |
minor_outage_alert_threshold | 5 | Number of errors that trigger a minor outage alert (400 errors not counted) |
major_outage_alert_threshold | 10 | Number of errors that trigger a major outage alert (400 errors not counted) |
max_outage_alert_list_size | 10 | Maximum number of errors to store in cache per model/region |
log_to_console | false | If true, prints alerting payload to console as a .warning log. |