Prometheus metrics
LiteLLM Exposes a /metrics endpoint for Prometheus to Poll
Quick Start
If you're using the LiteLLM CLI with litellm --config proxy_config.yaml then you need to uv add prometheus_client==0.20.0. This is already pre-installed on the litellm Docker image
Add this to your proxy config.yaml
model_list:
  - model_name: gpt-6.1-sol
    litellm_params:
      model: gpt-6.1-sol
litellm_settings:
  callbacks:
    - prometheus
Start the proxy
litellm --config config.yaml --debug
Test Request
curl --location 'http://0.0.0.0:4000/chat/completions' \
    --header 'Content-Type: application/json' \
    --data '{
    "model": "gpt-6.1-sol",
    "messages": [
        {
        "role": "user",
        "content": "what llm are you"
        }
    ]
}'
View Metrics on /metrics:
curl http://localhost:4000/metrics \
  -H "Authorization: Bearer sk-..."
Multiple Workers
When using LiteLLM with multiple workers, you need to set the PROMETHEUS_MULTIPROC_DIR environment variable to enable aggregated metric collection across worker processes.
export PROMETHEUS_MULTIPROC_DIR="/prometheus_multiproc"
This directory is used by the Prometheus client library to store metric files that can be shared across multiple worker processes. Make sure the directory exists and is writable by your LiteLLM process.
Isolate Prometheus scraping from inference traffic
By default, LiteLLM renders /metrics on the proxy port using the same Uvicorn workers that serve inference requests. In multi-worker deployments, each scrape aggregates Prometheus data across workers. Large or high-cardinality metric sets can therefore consume CPU on a request-serving worker and increase tail latency.
LiteLLM v1.101.0 and later can serve the same metric set from a dedicated process. Configure --prometheus_metrics_port or PROMETHEUS_METRICS_PORT, then update Prometheus to scrape that port. The original /metrics route on the proxy port remains available for backward compatibility, so you can migrate scrape targets without interrupting inference traffic.
The prometheus callback must be enabled. When the dedicated port is configured, LiteLLM creates PROMETHEUS_MULTIPROC_DIR if needed, binds the metrics process to the proxy --host, and stops the process with the proxy.
litellm --config config.yaml --num_workers 4 --prometheus_metrics_port 4001
scrape_configs:
  - job_name: litellm
    static_configs:
      - targets: ["litellm:4001"]
The dedicated listener does not use LiteLLM virtual-key authentication. require_auth_for_metrics_endpoint applies only to /metrics on the proxy port. Permit access only from trusted Prometheus or collector networks, and do not publish the dedicated port through a public ingress or load balancer.
Deployment configuration
- Helm: litellm-helm
- Helm: componentized
- Terraform: AWS
metricsServer:
  enabled: true
  port: 4001

serviceMonitor:
  enabled: true
The chart creates a dedicated <release>-litellm-metrics ClusterIP Service and directs the ServiceMonitor to it. The primary Service is unchanged, including when service.type is LoadBalancer. metricsServer.port must differ from service.port.
gateway:
  metricsServer:
    enabled: true
    port: 4001
The chart runs the metrics server as a sidecar that shares Prometheus multiprocess data with the gateway. It exposes the listener through a dedicated <release>-litellm-gateway-metrics ClusterIP Service; configure Prometheus to discover that private Service. The gateway Service remains unchanged.
module "litellm" {
  source  = "BerriAI/litellm/aws"
  version = "~> 1.101"

  gateway_metrics_port         = 4001
  gateway_metrics_scrape_cidrs = ["10.0.0.0/16"]
}
The module adds a nonessential metrics sidecar to the gateway task and permits inbound traffic on that port only from gateway_metrics_scrape_cidrs. The Application Load Balancer does not route to the metrics port. The feature is disabled when gateway_metrics_port is null, which is the default, and port 4000 is reserved for gateway traffic.
Validate the rollout
Check the dedicated process before changing the Prometheus target:
curl -fsS http://litellm:4001/health
# {"status":"healthy","multiproc_dir":"..."}

curl -fsS http://litellm:4001/metrics/ | head
The dedicated endpoint supports the same metrics, label configuration, filtering, and compression as the proxy-port endpoint. Proxy readiness remains available at /health/readiness on port 4000.
Virtual Keys, Teams, Internal Users
Use this for tracking per user, key, team, etc.
| Metric Name | Description |
|---|---|
litellm_spend_metric | Total Spend, per "end_user", "hashed_api_key", "api_key_alias", "model", "team", "team_alias", "user", "user_email", "client_ip", "user_agent", "requested_model", "model_id", "api_provider", "service_tier" |
litellm_total_tokens_metric | input + output tokens per "end_user", "hashed_api_key", "api_key_alias", "model", "team", "team_alias", "user", "user_email", "requested_model", "model_id", "api_provider" |
litellm_input_tokens_metric | input tokens per "end_user", "hashed_api_key", "api_key_alias", "model", "team", "team_alias", "user", "user_email", "requested_model", "model_id", "api_provider" |
litellm_output_tokens_metric | output tokens per "end_user", "hashed_api_key", "api_key_alias", "model", "team", "team_alias", "user", "user_email", "requested_model", "model_id", "api_provider" |
Token type detail metrics
Per-token-type counters that break out the usage.prompt_tokens_details and usage.completion_tokens_details fields providers report (e.g. OpenAI prompt caching, Anthropic prompt caching, audio I/O, reasoning tokens). These are additive to the totals above, and the existing litellm_input_tokens_metric / litellm_output_tokens_metric / litellm_total_tokens_metric counters are unchanged.
Each detail counter is sparse: it is only incremented when the provider reports a non-zero value for the corresponding field, so providers that don't expose a given detail will not produce a series for it. The label set is identical to the parent input / output token counter, so you can join cleanly in PromQL.
| Metric Name | Source field on usage | Typical providers |
|---|---|---|
litellm_input_cached_tokens_metric | prompt_tokens_details.cached_tokens | OpenAI prompt cache, Anthropic cache_read_input_tokens, DeepSeek prompt_cache_hit_tokens |
litellm_input_cache_creation_tokens_metric | prompt_tokens_details.cache_creation_tokens | Anthropic cache_creation_input_tokens (prompt cache writes) |
litellm_input_audio_tokens_metric | prompt_tokens_details.audio_tokens | OpenAI gpt-4o-audio-*, Gemini audio inputs |
litellm_output_reasoning_tokens_metric | completion_tokens_details.reasoning_tokens | OpenAI o1-* / o3-*, Anthropic extended thinking |
litellm_output_audio_tokens_metric | completion_tokens_details.audio_tokens | OpenAI gpt-4o-audio-* audio outputs |
Example PromQL, cache-hit ratio for a model group:
sum by (requested_model) (rate(litellm_input_cached_tokens_metric_total[5m]))
/
sum by (requested_model) (rate(litellm_input_tokens_metric_total[5m]))
Example PromQL, reasoning-token share of output:
sum by (requested_model) (rate(litellm_output_reasoning_tokens_metric_total[5m]))
/
sum by (requested_model) (rate(litellm_output_tokens_metric_total[5m]))
litellm_input_cached_tokens_metric tracks provider-side prompt-cache reads (the provider reports a cached portion of the input). This is different from litellm_cached_tokens_metric, which tracks LiteLLM's own response-cache hits (the entire response was served from LiteLLM's cache and no provider request was made).
Cache Metrics
Track LiteLLM's own response cache. All three metrics carry the labels "model", "hashed_api_key", "api_key_alias", "team", "team_alias", "end_user", "user", "model_id", "api_provider".
| Metric Name | Description |
|---|---|
litellm_cache_hits_metric | Requests served entirely from LiteLLM's response cache (no provider request made) |
litellm_cache_misses_metric | Requests that missed LiteLLM's response cache |
litellm_cached_tokens_metric | Tokens served from LiteLLM's response cache |
Team - Budget
| Metric Name | Description |
|---|---|
litellm_team_max_budget_metric | Max Budget for Team Labels: "team", "team_alias" |
litellm_remaining_team_budget_metric | Remaining Budget for Team (A team created on LiteLLM) Labels: "team", "team_alias" |
litellm_team_budget_remaining_hours_metric | Hours before the team budget is reset Labels: "team", "team_alias" |
Virtual Key - Budget
| Metric Name | Description |
|---|---|
litellm_api_key_max_budget_metric | Max Budget for API Key Labels: "hashed_api_key", "api_key_alias" |
litellm_remaining_api_key_budget_metric | Remaining Budget for API Key (A key Created on LiteLLM) Labels: "hashed_api_key", "api_key_alias" |
litellm_api_key_budget_remaining_hours_metric | Hours before the API Key budget is reset Labels: "hashed_api_key", "api_key_alias" |
Internal User - Budget
Only emitted for requests attached to an internal user; the max budget and reset hours gauges additionally require the user to have a budget set. Use Initialize Budget Metrics on Startup to emit them for all users on a schedule.
| Metric Name | Description |
|---|---|
litellm_remaining_user_budget_metric | Remaining Budget for Internal User Labels: "user" |
litellm_user_max_budget_metric | Max Budget for Internal User Labels: "user" |
litellm_user_budget_remaining_hours_metric | Hours before the Internal User budget is reset Labels: "user" |
Organization - Budget
Only emitted for requests attached to an organization, with the same conditions as the internal user metrics above.
| Metric Name | Description |
|---|---|
litellm_remaining_org_budget_metric | Remaining Budget for Organization Labels: "org_id", "org_alias" |
litellm_org_max_budget_metric | Max Budget for Organization Labels: "org_id", "org_alias" |
litellm_org_budget_remaining_hours_metric | Hours before the Organization budget is reset Labels: "org_id", "org_alias" |
Customer (end_user) - Budget
Only emitted when end_user tracking is enabled. On each request the remaining and max budget gauges are refreshed for the request's customer from the customer row cached during auth (no extra database query; a cache miss is left to the periodic refresh); the reset hours gauge and customers without recent traffic are covered by Initialize Budget Metrics on Startup, which emits all three gauges for every customer that has a budget attached. When max_end_user_budget_id is set, customers without their own budget are emitted against that default budget. The series are subject to the end_user cardinality caps described in Tracking end_user on Prometheus.
| Metric Name | Description |
|---|---|
litellm_remaining_customer_budget_metric | Remaining Budget for Customer Labels: "end_user" |
litellm_customer_max_budget_metric | Max Budget for Customer Labels: "end_user" |
litellm_customer_budget_remaining_hours_metric | Hours before the Customer budget is reset Labels: "end_user" |
Virtual Key - Rate Limit
| Metric Name | Description |
|---|---|
litellm_remaining_api_key_requests_for_model | Remaining Requests for a LiteLLM virtual API key, only if a model-specific rate limit (rpm) has been set for that virtual key. Labels: "hashed_api_key", "api_key_alias", "model", "model_id" |
litellm_remaining_api_key_tokens_for_model | Remaining Tokens for a LiteLLM virtual API key, only if a model-specific token limit (tpm) has been set for that virtual key. Labels: "hashed_api_key", "api_key_alias", "model", "model_id" |
Initialize Budget Metrics on Startup
If you want litellm to emit the budget metrics for all keys, teams irrespective of whether they are getting requests or not, set prometheus_initialize_budget_metrics to true in the config.yaml
How this works:
- If the
prometheus_initialize_budget_metricsis set totrue- Every 5 minutes litellm runs a cron job to read all keys, teams, internal users, and organizations from the database
- It then emits the budget metrics for each of them
- This is used to populate the budget metrics on the
/metricsendpoint
litellm_settings:
  callbacks: ["prometheus"]
  prometheus_initialize_budget_metrics: true
Pod Health Metrics
Use these to measure per-pod queue depth and diagnose latency that occurs before LiteLLM starts processing a request.
| Metric Name | Type | Description |
|---|---|---|
litellm_in_flight_requests | Gauge | Number of HTTP requests currently in-flight on this uvicorn worker. Tracks the pod's queue depth in real time. With multiple workers, values are summed across all live workers (livesum). |
litellm_admission_admitted_requests | Gauge | Requests currently holding a per-worker admission slot. Only populated when per-worker admission control is enabled. Summed across live workers (livesum). |
litellm_admission_queued_requests | Gauge | Requests waiting for a per-worker admission slot. Summed across live workers (livesum). |
litellm_admission_rejected_requests_total | Counter | Requests rejected with 503 by admission control, labelled by reason: queue_full (queue already at its cap on arrival) or queue_timeout (waited admission_queue_timeout_seconds without getting a slot). |
When to use this
LiteLLM measures latency from when its handler starts. If a request waits in uvicorn's event loop before the handler runs, that wait is invisible to LiteLLM's own logs. litellm_in_flight_requests shows how loaded the pod was at any point in time.
high in_flight_requests + high ALB TargetResponseTime → pod overloaded, scale out
low  in_flight_requests + high ALB TargetResponseTime → delay is pre-ASGI (event loop blocking)
You can also check the current value directly without Prometheus:
curl http://localhost:4000/health/backlog \
  -H "Authorization: Bearer sk-..."
# {"in_flight_requests": 47}
Proxy Level Tracking Metrics
Use this to track overall LiteLLM Proxy usage.
- Track Actual traffic rate to proxy
- Number of client side requests and failures for requests made to proxy
| Metric Name | Description |
|---|---|
litellm_proxy_failed_requests_metric | Total number of failed responses from proxy - the client did not get a success response from litellm proxy. Labels: "end_user", "hashed_api_key", "api_key_alias", "requested_model", "team", "team_alias", "user", "user_email", "exception_status", "exception_class", "route", "client_ip", "user_agent", "model_id", "api_provider" |
litellm_proxy_total_requests_metric | Total number of requests made to the proxy server - track number of client side requests. Labels: "end_user", "hashed_api_key", "api_key_alias", "requested_model", "team", "team_alias", "user", "status_code", "user_email", "route", "client_ip", "user_agent", "model_id", "api_provider". Optionally includes "stream" — see Emit Stream Label. |
Callback Logging Metrics
Monitor failures while shipping logs to downstream callbacks like S3 cold storage
| Metric Name | Description |
|---|---|
litellm_callback_logging_failures_metric | Total number of failed attempts to emit logs to a configured callback. Labels: "callback_name". Use this to alert on callback delivery issues such as repeated failures when writing to S3, langfuse, or langfuse_otel and other otel providers |
Supported Callbacks:
S3Logger- S3 cold storage failureslangfuse- Langfuse logging failuresotel- OpenTelemetry logging failures
Guardrail Metrics
Only emitted when guardrails run.
| Metric Name | Description |
|---|---|
litellm_guardrail_requests_total | Total number of guardrail invocations. Labels: "guardrail_name", "status", "hook_type" |
litellm_guardrail_errors_total | Total number of errors encountered during guardrail execution. Labels: "guardrail_name", "error_type", "hook_type" |
litellm_guardrail_latency_seconds | Histogram of guardrail execution latency (seconds). Labels: "guardrail_name", "status", "error_type", "hook_type" |
MCP Gateway Metrics
Only emitted for MCP tool calls made through the MCP gateway. Both metrics carry the labels "mcp_tool_name", "mcp_server_name", "hashed_api_key", "api_key_alias", "team", "team_alias", "user", "end_user".
| Metric Name | Description |
|---|---|
litellm_mcp_tool_calls_total | Total MCP tool calls, segmented by tool and server name |
litellm_mcp_tool_call_spend_metric | Total spend on MCP tool calls; only incremented when the call has a nonzero cost |
Managed Batch Metrics
Enterprise only. Emitted when using LiteLLM managed batches and the CheckBatchCost background job that cost-tracks them.
| Metric Name | Description |
|---|---|
litellm_managed_batch_created_total | Total number of managed batches created. Labels: "model", "api_provider", "user", "user_email", "api_key_alias" |
litellm_managed_file_created_total | Total number of managed files created. Labels: "model", "api_provider", "user", "user_email", "api_key_alias" |
litellm_managed_file_deleted_total | Total number of managed file deletions, success or blocked. Labels: "result" |
litellm_managed_file_size_bytes | Size of the most recent managed batch file in bytes, last-seen value per label combination. Labels: "purpose", "file_type", "model", "api_provider", "user" |
litellm_managed_batch_duration_seconds | Histogram of completed batch duration in seconds (completed_at - created_at). Labels: "model", "api_provider" |
litellm_check_batch_cost_jobs_polled | Number of unprocessed batches found by the last CheckBatchCost poll |
litellm_check_batch_cost_jobs_processed_total | Total number of batches successfully cost-tracked by CheckBatchCost. Labels: "model", "api_provider" |
litellm_check_batch_cost_errors_total | Total number of errors in CheckBatchCost by error type. Labels: "error_type" |
litellm_check_batch_cost_last_run_timestamp | Unix timestamp of the last CheckBatchCost job run |
LLM Provider Metrics
Use this for LLM API Error monitoring and tracking remaining rate limits and token limits
Labels Tracked
| Label | Description |
|---|---|
| litellm_model_name | The name of the LLM model used by LiteLLM |
| requested_model | The model sent in the request |
| model_group | The model_name from config.yaml the deployment belongs to; group by it to see one series per model pool |
| model_id | The model_id of the deployment. Autogenerated by LiteLLM, each deployment has a unique model_id |
| api_base | The API Base of the deployment |
| api_provider | The LLM API provider, used for the provider. Example (azure, openai, vertex_ai) |
| hashed_api_key | The hashed api key of the request |
| api_key_alias | The alias of the api key used |
| team | The team of the request |
| team_alias | The alias of the team used |
| exception_status | The status of the exception, if any |
| exception_class | The class of the exception, if any |
Success and Failure
| Metric Name | Description |
|---|---|
litellm_deployment_success_responses | Total number of successful LLM API calls for deployment. Labels: "model_group", "requested_model", "litellm_model_name", "model_id", "api_base", "api_provider", "hashed_api_key", "api_key_alias", "team", "team_alias", "client_ip", "user_agent" |
litellm_deployment_failure_responses | Total number of failed LLM API calls for a specific LLM deployment. Labels: "model_group", "requested_model", "litellm_model_name", "model_id", "api_base", "api_provider", "exception_status", "exception_class", "hashed_api_key", "api_key_alias", "team", "team_alias", "client_ip", "user_agent" |
litellm_deployment_total_requests | Total number of LLM API calls for deployment - success + failure. Labels: "model_group", "requested_model", "litellm_model_name", "model_id", "api_base", "api_provider", "hashed_api_key", "api_key_alias", "team", "team_alias", "client_ip", "user_agent" |
Remaining Requests and Tokens
| Metric Name | Description |
|---|---|
litellm_remaining_requests_metric | Track x-ratelimit-remaining-requests returned from LLM API Deployment. Labels: "model_group", "api_provider", "api_base", "litellm_model_name", "hashed_api_key", "api_key_alias", "model_id" |
litellm_remaining_tokens_metric | Track x-ratelimit-remaining-tokens return from LLM API Deployment. Labels: "model_group", "api_provider", "api_base", "litellm_model_name", "hashed_api_key", "api_key_alias", "model_id" |
Provider Budget
| Metric Name | Description |
|---|---|
litellm_provider_remaining_budget_metric | Remaining budget for an LLM provider; only emitted when provider budget routing is configured. Labels: "api_provider" |
Spend Capture Rate
| Metric Name | Description |
|---|---|
litellm_spend_capture_rate | Share of the provider's bill LiteLLM captured as spend over the scheduled capture-rate check's window (captured spend / provider bill). NaN when the last check produced no rate, and on every proxy with a database where the check is not configured. Labels: "api_provider" |
Deployment State
| Metric Name | Description |
|---|---|
litellm_deployment_state | The state of the deployment: 0 = healthy, 1 = partial outage, 2 = complete outage. Labels: "litellm_model_name", "model_id", "api_base", "api_provider" |
litellm_deployment_latency_per_output_token | Latency per output token for deployment. Labels: "model_group", "litellm_model_name", "model_id", "api_base", "api_provider", "hashed_api_key", "api_key_alias", "team", "team_alias" |
litellm_deployment_tpm_limit | Configured TPM limit for the deployment; only set for deployments with a tpm limit in config. Labels: "model_group", "litellm_model_name", "model_id", "api_base", "api_provider" |
litellm_deployment_rpm_limit | Configured RPM limit for the deployment; only set for deployments with an rpm limit in config. Labels: "model_group", "litellm_model_name", "model_id", "api_base", "api_provider" |
Fallback (Failover) Metrics
| Metric Name | Description |
|---|---|
litellm_deployment_cooled_down | Number of times a deployment has been cooled down by LiteLLM load balancing logic. Labels: "litellm_model_name", "model_id", "api_base", "api_provider", "exception_status" |
litellm_deployment_successful_fallbacks | Number of successful fallback requests from primary model -> fallback model. Labels: "requested_model", "fallback_model", "hashed_api_key", "api_key_alias", "team", "team_alias", "exception_status", "exception_class", "model_id" |
litellm_deployment_failed_fallbacks | Number of failed fallback requests from primary model -> fallback model. Labels: "requested_model", "fallback_model", "hashed_api_key", "api_key_alias", "team", "team_alias", "exception_status", "exception_class", "model_id" |
Request Counting Metrics
| Metric Name | Description |
|---|---|
litellm_requests_metric | deprecated use litellm_proxy_total_requests_metric. Total number of LLM calls to litellm, tracked per API key, team, user. Labels: "end_user", "hashed_api_key", "api_key_alias", "model", "team", "team_alias", "user", "user_email", "client_ip", "user_agent", "requested_model", "model_id", "api_provider" |
litellm_zero_cost_requests_total | Requests that carried usage but were logged at $0 on a model whose pricing entry has a non-zero rate. Free models and requests without usage are not counted. Labels: "requested_model", "model", "model_id", "api_provider", "reason" where reason is missing_pricing_key, pricing_not_applied or cost_calculation_error. Each counted request also logs one warning naming the missing pricing key, see Requests that price to $0 |
Request Latency Metrics
Use litellm_request_total_latency_metric for latency SLOs and alerts. It measures the full request from arrival at the proxy through the end of processing. If total latency increases, use the other metrics to identify whether the delay comes from authentication, the LLM provider, or LiteLLM processing.
All request latency metrics are Prometheus histograms measured in seconds.
| What you want to measure | Metric | Measurement window |
|---|---|---|
| End-to-end latency | litellm_request_total_latency_metric | Request arrival to the end of processing. Includes authentication, pre-call hooks, the LLM API call, and post-call processing. |
| Authentication and request wait time | litellm_request_queue_time_seconds | Request arrival to the start of pre-call processing. Includes authentication and ASGI-level queueing. Compare this with litellm_in_flight_requests when diagnosing overloaded proxy pods. |
| LLM provider latency | litellm_llm_api_latency_metric | LLM API call start to finish. |
| Time to first token | litellm_llm_api_time_to_first_token_metric | LLM API call start to the first token. Emitted only for streaming requests. |
| LiteLLM processing overhead | litellm_overhead_latency_metric | LiteLLM processing time, excluding the LLM API call and guardrails. |
| LiteLLM processing and guardrail overhead | litellm_overhead_with_guardrails_latency_metric | LiteLLM processing time plus pre-call and post-call guardrails, excluding the LLM API call. During-call guardrails run concurrently with the LLM API call and are not included. |
For example, this query returns end-to-end p95 latency over the last five minutes:
histogram_quantile(0.95, sum by (le) (rate(litellm_request_total_latency_metric_bucket[5m])))
Group by model_group to get one p95 per model pool from config.yaml, across every deployment behind it:
histogram_quantile(0.95, sum by (model_group, le) (rate(litellm_request_total_latency_metric_bucket[5m])))
Labels for request latency metrics
| Metrics | Labels |
|---|---|
litellm_request_total_latency_metriclitellm_llm_api_latency_metriclitellm_llm_api_time_to_first_token_metric | model_group, end_user, hashed_api_key, api_key_alias, requested_model, team, team_alias, user, model, model_id, api_provider, service_tier |
litellm_request_queue_time_seconds | end_user, hashed_api_key, api_key_alias, requested_model, team, team_alias, user, model, model_id, api_provider |
litellm_overhead_latency_metriclitellm_overhead_with_guardrails_latency_metric | model_group, api_provider, api_base, litellm_model_name, hashed_api_key, api_key_alias, model_id |
litellm_request_queue_time_seconds does not include service_tier because the provider has not selected a service tier when this metric is recorded.
Configure caller identity on deployment and latency metrics
By default, deployment counters and caller-scoped latency histograms identify the caller with api_key_alias. Set prometheus_deployment_and_latency_caller_identity to use user_email instead, or to expose both labels:
litellm_settings:
  callbacks: ["prometheus"]
  prometheus_deployment_and_latency_caller_identity: user_email
| Value | Caller identity labels | Behavior |
|---|---|---|
api_key_alias (default) | api_key_alias | Preserves the existing metric schema and existing queries. |
user_email | user_email | Replaces api_key_alias at the same position in the label schema. |
both | api_key_alias, then user_email | Emits both dimensions. user_email is placed immediately after api_key_alias. |
The setting applies only to these metric families:
litellm_deployment_total_requestslitellm_deployment_success_responseslitellm_deployment_failure_responseslitellm_request_total_latency_metriclitellm_llm_api_latency_metriclitellm_llm_api_time_to_first_token_metriclitellm_request_queue_time_secondslitellm_overhead_latency_metriclitellm_deployment_latency_per_output_token
It does not change related metrics that are not caller-scoped, or the guardrail-inclusive litellm_overhead_with_guardrails_latency_metric. Counter samples use the Prometheus _total suffix, and histogram _bucket, _sum, and _count samples all receive the selected identity label or labels.
Requests without a resolved email use LiteLLM's established "None" label value. For example, these queries group provider requests and p95 end-to-end latency by resolved email while excluding requests with no email:
sum by (user_email) (
  rate(litellm_deployment_total_requests_total{user_email!="None"}[5m])
)
histogram_quantile(
  0.95,
  sum by (user_email, le) (
    rate(litellm_request_total_latency_metric_bucket{user_email!="None"}[5m])
  )
)
prometheus_metrics_config.include_labels is validated against the selected mode. In api_key_alias mode it can include api_key_alias; in user_email mode it can include user_email; and in both mode it can include either or both. An invalid mode value fails proxy startup with a ValueError naming the accepted values, and user_email mode combined with include_labels: [api_key_alias] on an affected family also fails startup, naming both settings. prometheus_exclude_labels is applied afterward and can remove either identity label. For example, selecting both globally and excluding api_key_alias leaves only user_email on the affected families.
Changing this setting changes fixed Prometheus collector label schemas. Restart every LiteLLM Proxy/logger process after changing it; a live configuration reload cannot rebuild existing collectors.
Email addresses are sensitive data. Keep the default unless email-level attribution is required, retain authentication on /metrics, and restrict network access to trusted Prometheus scrapers.
both records one series per observed complete label tuple; it does not create a second series for the same request. If aliases and emails have a stable one-to-one mapping, adding the email label does not increase the number of distinct series. Cardinality can increase when aliases are reused across users, mappings change over time, or the same alias is observed with both a resolved and an absent email.
Segmenting latency and spend by service tier
The service_tier label on the request latency metrics and on litellm_spend_metric carries the tier a request actually ran on, so you can compare latency and cost before and after moving traffic to a cheaper or a faster tier:
histogram_quantile(0.95, sum by (service_tier, le) (rate(litellm_request_total_latency_metric_bucket[5m])))
The value is the tier the provider reports it served, which is what makes a request sent with "service_tier": "auto" show up under the concrete tier the provider picked (for example default) rather than under auto. When a provider reports no tier, the tier named in the request is used, and a request that neither asks for nor gets a tier is labelled with an empty value
Tracking end_user on Prometheus
By default LiteLLM does not track end_user on Prometheus. This is done to reduce the cardinality of the metrics from LiteLLM Proxy.
If you want to track end_user on Prometheus, you can do the following:
litellm_settings:
  callbacks: ["prometheus"]
  enable_end_user_cost_tracking_prometheus_only: true
Every metric that carries the end_user label, including the customer budget gauges, is capped per metric by prometheus_end_user_metrics_max_series_per_metric (default 10000, oldest series are dropped first) and series idle for longer than prometheus_end_user_metrics_ttl_seconds (default 3600) are removed. Set either to null to disable that limit.
litellm_settings:
  callbacks: ["prometheus"]
  enable_end_user_cost_tracking_prometheus_only: true
  prometheus_end_user_metrics_max_series_per_metric: 500
  prometheus_end_user_metrics_ttl_seconds: 1800
Emit Stream Label
Add a stream label to litellm_proxy_total_requests_metric to split requests by streaming vs. non-streaming. Disabled by default.
litellm_settings:
  callbacks: ["prometheus"]
  prometheus_emit_stream_label: true
When enabled, litellm_proxy_total_requests_metric gains a stream label with values "True", "False", or "None".
litellm_proxy_total_requests_metric{..., stream="True"} 42
litellm_proxy_total_requests_metric{..., stream="False"} 100
This label is opt-in because adding a new label to an existing metric changes its cardinality and breaks existing Prometheus queries / Grafana dashboards that target this metric. Enable it only on fresh deployments or when you are ready to update your dashboards.
[BETA] Custom Metrics
Track custom metrics on prometheus on all events mentioned above.
Custom Metadata Labels
- Define the custom metadata labels in the
config.yaml
model_list:
  - model_name: openai/gpt-6.1-sol
    litellm_params:
      model: openai/gpt-6.1-sol
      api_key: os.environ/OPENAI_API_KEY

litellm_settings:
  callbacks: ["prometheus"]
  custom_prometheus_metadata_labels: ["metadata.foo", "metadata.bar"]
- Make a request with the custom metadata labels
- Curl Request
- on Key
- on Team
curl -L -X POST 'http://0.0.0.0:4000/v1/chat/completions' \
-H 'Content-Type: application/json' \
-H 'Authorization: Bearer <LITELLM_API_KEY>' \
-d '{
    "model": "openai/gpt-6.1-sol",
    "messages": [
      {
        "role": "user",
        "content": [
          {
            "type": "text",
            "text": "What's in this image?"
          }
        ]
      }
    ],
    "max_tokens": 300,
    "metadata": {
        "foo": "hello world"
    }
}'
curl -L -X POST 'http://0.0.0.0:4000/key/generate' \
-H "Authorization: Bearer $LITELLM_API_KEY" \
-H 'Content-Type: application/json' \
-d '{
    "metadata": {
        "foo": "hello world"
    }
}'
curl -L -X POST 'http://0.0.0.0:4000/team/new' \
-H "Authorization: Bearer $LITELLM_API_KEY" \
-H 'Content-Type: application/json' \
-d '{
    "metadata": {
        "foo": "hello world"
    }
}'
- Check your
/metricsendpoint for the custom metrics
... "metadata_foo": "hello world" ...
Custom Tags
Track specific tags as prometheus labels for better filtering and monitoring.
- Define the custom tags in the
config.yaml
model_list:
  - model_name: openai/gpt-6.1-sol
    litellm_params:
      model: openai/gpt-6.1-sol
      api_key: os.environ/OPENAI_API_KEY

litellm_settings:
  callbacks: ["prometheus"]
  custom_prometheus_metadata_labels: ["metadata.foo", "metadata.bar"]
  custom_prometheus_tags:
    - "prod"
    - "staging"
    - "batch-job"
    - "User-Agent: RooCode/*"
    - "User-Agent: claude-cli/*"
- Make a request with tags
curl -L -X POST 'http://0.0.0.0:4000/v1/chat/completions' \
-H 'Content-Type: application/json' \
-H 'Authorization: Bearer <LITELLM_API_KEY>' \
-d '{
    "model": "openai/gpt-6.1-sol",
    "messages": [
      {
        "role": "user",
        "content": [
          {
            "type": "text",
            "text": "What's in this image?"
          }
        ]
      }
    ],
    "max_tokens": 300,
    "metadata": {
        "tags": ["prod", "user-facing"]
    }
}'
- Check your
/metricsendpoint for the custom tag metrics
... "tag_prod": "true", "tag_staging": "false", "tag_batch_job": "false" ...
How Custom Tags Work:
- Each configured tag becomes a boolean label in prometheus metrics
- If a tag matches (exact or wildcard), the label value is
"true", otherwise"false" - Tag names are sanitized for prometheus compatibility (e.g.,
"batch-job"becomes"tag_batch_job") - Wildcard patterns supported using
*(e.g.,"User-Agent: RooCode/*"matches"User-Agent: RooCode/1.0.0")
Example with wildcards:
litellm_settings:
  callbacks: ["prometheus"]
  custom_prometheus_tags:
    - "User-Agent: RooCode/*"
    - "User-Agent: claude-cli/*"
Use Cases:
- Environment tracking (
prod,staging,dev) - Request type classification (
batch-job,user-facing,background) - Feature flags (
new-feature,beta-users) - Team or service identification (
team-a,service-xyz) - User-Agent Tracking - use this to track how much Roo Code, Claude Code, Gemini CLI are used (
User-Agent: RooCode/*,User-Agent: claude-cli/*,User-Agent: gemini-cli/*)
Configuring Metrics and Labels
You can selectively enable specific metrics and control which labels are included to optimize performance and reduce cardinality.
Enable Specific Metrics and Labels
Configure which metrics to emit by specifying them in prometheus_metrics_config. Each configuration group needs a group name (for organization) and a list of metrics to enable. You can optionally include a list of include_labels to filter the labels for the metrics.
model_list:
  - model_name: gpt-6.1-sol
    litellm_params:
      model: gpt-6.1-sol

litellm_settings:
  callbacks: ["prometheus"]
  prometheus_metrics_config:
    # High-cardinality metrics with minimal labels
    - group: "proxy_metrics"
      metrics:
        - "litellm_proxy_total_requests_metric"
        - "litellm_proxy_failed_requests_metric"
      include_labels:
        - "hashed_api_key"
        - "requested_model"
        - "model_group"
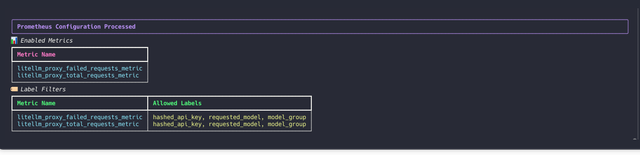
On starting up LiteLLM if your metrics were correctly configured, you should see the following on your container logs
Filter Labels Per Metric
Control which labels are included for each metric to reduce cardinality:
litellm_settings:
  callbacks: ["prometheus"]
  prometheus_metrics_config:
    - group: "token_consumption"
      metrics:
        - "litellm_input_tokens_metric"
        - "litellm_output_tokens_metric"
        - "litellm_total_tokens_metric"
      include_labels:
        - "model"
        - "team"
        - "hashed_api_key"
    - group: "request_tracking"
      metrics:
        - "litellm_proxy_total_requests_metric"
      include_labels:
        - "status_code"
        - "requested_model"
Advanced Configuration
You can create multiple configuration groups with different label sets:
litellm_settings:
  callbacks: ["prometheus"]
  prometheus_metrics_config:
    # High-cardinality metrics with minimal labels
    - group: "deployment_health"
      metrics:
        - "litellm_deployment_success_responses"
        - "litellm_deployment_failure_responses"
      include_labels:
        - "api_provider"
        - "requested_model"

    # Budget metrics with full label set
    - group: "budget_tracking"
      metrics:
        - "litellm_remaining_team_budget_metric"
      include_labels:
        - "team"
        - "team_alias"
        - "hashed_api_key"
        - "api_key_alias"
        - "model"
        - "end_user"

    # Latency metrics with performance-focused labels
    - group: "performance"
      metrics:
        - "litellm_request_total_latency_metric"
        - "litellm_llm_api_latency_metric"
      include_labels:
        - "model"
        - "api_provider"
        - "requested_model"
Configuration Structure:
group: A descriptive name for organizing related metricsmetrics: List of metric names to include in this groupinclude_labels: (Optional) List of labels to include for these metrics
Default Behavior: If no prometheus_metrics_config is specified, all metrics are enabled with their default labels (backward compatible).
Exclude Metrics and Labels Globally
prometheus_metrics_config is include-based, so it requires you to enumerate every metric you want to keep. When you only want to drop a small set of metrics or labels, use the global prometheus_exclude_metrics and prometheus_exclude_labels options instead. Everything not listed stays enabled with its default labels, and metrics added in future LiteLLM releases are emitted automatically without further config changes.
litellm_settings:
  callbacks: ["prometheus"]
  # Drop these metrics entirely
  prometheus_exclude_metrics:
    - "litellm_input_tokens_metric"
    - "litellm_output_tokens_metric"
  # Drop these labels from every metric that would otherwise emit them
  prometheus_exclude_labels:
    - "hashed_api_key"
    - "api_key_alias"
Both lists are validated at startup; an unknown metric or label name raises a configuration error so typos surface immediately. Exclusion always wins, so a metric named in prometheus_exclude_metrics is dropped even if a prometheus_metrics_config group enables it, and a label in prometheus_exclude_labels is removed even when a group's include_labels lists it.
Cap Series per Metric
Every distinct label combination a metric has ever seen stays in the proxy's memory until the process restarts, so labels such as user, user_email, hashed_api_key, api_key_alias, client_ip, and user_agent grow the metric state with every new caller. Dropping the labels you do not query is the first lever (above). When a label has to stay, set prometheus_metrics_max_series_per_metric to bound how many series each metric keeps. It is off by default and applies to every labeled metric the prometheus callback emits
litellm_settings:
  callbacks: ["prometheus"]
  prometheus_metrics_max_series_per_metric: 5000
The first 5000 label combinations a metric sees keep a series of their own. For a counter or histogram, every later combination is recorded on one extra series whose labels are all other, so sums over the metric stay exact and only the per-label breakdown of the overflow is lost. A gauge skips combinations past the cap, because one gauge value shared by many callers would mean nothing. A value that is not a number greater than 0 is ignored: the proxy logs a warning naming the setting and the value at startup and emits metrics without a cap
The cap is counted per proxy instance. With multiple workers, the workers of one instance agree on which 5000 combinations keep a series, through one small file per metric in PROMETHEUS_MULTIPROC_DIR, so a scrape that merges the workers still shows the cap plus the other series, and a worker that is replaced, for example by --max_requests_before_restart, keeps the same combinations. Across instances the cap is not shared, so once an instance has hit its cap a combination it kept may be other on another instance, and a fleet-wide sum of that one series only counts the instances that kept it. Gauges are the exception with multiple workers, since each worker exports its gauges under its own pid label, so a gauge can show up to the cap per worker
To free slots held by callers that went away, also set prometheus_metrics_ttl_seconds. A series that has not been updated for that many seconds is removed, checked at most every prometheus_metrics_cleanup_interval_seconds (default 60), and its slot goes to the next new label combination. A removed series disappears from /metrics until it is emitted again, at which point its counter restarts from zero, which PromQL rate() and increase() treat as a counter reset. A TTL that is not a number greater than 0 is ignored with the same startup warning, and a cleanup interval that is not a number of 0 or more is ignored with the same warning while the checks keep the default 60 seconds
litellm_settings:
  callbacks: ["prometheus"]
  prometheus_metrics_max_series_per_metric: 5000
  prometheus_metrics_ttl_seconds: 3600
The TTL only works in single-process mode. With PROMETHEUS_MULTIPROC_DIR set (multiple workers or the dedicated metrics port), the Prometheus client library cannot remove a series it has written, so LiteLLM ignores prometheus_metrics_ttl_seconds there and logs a warning at startup. The cap still holds in that mode, and slots are freed when the proxy restarts, because litellm wipes that directory at boot whenever PROMETHEUS_MULTIPROC_DIR is set, with one worker too, so the samples of the workers that exited do not keep the merged scrape past the cap. If you start the workers yourself instead of through litellm, wipe PROMETHEUS_MULTIPROC_DIR before they start
The end_user caps in Tracking end_user on Prometheus are separate settings and still apply to metrics that carry the end_user label
Monitor System Health
To monitor the health of litellm adjacent services (redis / postgres), do:
model_list:
  - model_name: gpt-6.1-sol
    litellm_params:
      model: gpt-6.1-sol
litellm_settings:
  service_callback: ["prometheus_system"]
Each monitored service emits three metrics, named litellm_<service>_<type>:
| Metric Name | Type | Description |
|---|---|---|
litellm_<service>_latency | Histogram | Latency (seconds) for calls to the service |
litellm_<service>_failed_requests_total | Counter | Number of failed calls to the service. Labels: "error_class", "function_name" for debugging what is failing |
litellm_<service>_total_requests_total | Counter | Total number of calls to the service, use it with the failed counter to compute an error rate |
The monitored services are:
| Service | Description |
|---|---|
redis | Redis calls (caching, rate limiting state) |
postgres | Postgres DB calls (keys, teams, spend logs). Example: litellm_postgres_latency, litellm_postgres_failed_requests_total, litellm_postgres_total_requests_total |
auth | Request authentication checks. Useful for catching auth slowness caused by an overloaded DB |
batch_write_to_db | Batched spend/usage writes to the DB |
reset_budget_job | The periodic budget reset job |
router | LiteLLM router operations |
proxy_pre_call | Pre-call hooks run by the proxy before hitting the LLM API |
self | LiteLLM's own API call handling |
Example alerts, DB failing or slow:
rate(litellm_postgres_failed_requests_total[5m]) > 0
histogram_quantile(0.95, sum by (le) (rate(litellm_postgres_latency_bucket[5m]))) > 1
DB Transaction Queue Health Metrics
Use these metrics to monitor the health of the DB Transaction Queue. Eg. Monitoring the size of the in-memory and redis buffers.
| Metric Name | Description | Storage Type |
|---|---|---|
litellm_pod_lock_manager_size | Indicates which pod has the lock to write updates to the database. | Redis |
litellm_in_memory_daily_spend_update_queue_size | Number of items in the in-memory daily spend update queue. These are the aggregate spend logs for each user. | In-Memory |
litellm_redis_daily_spend_update_queue_size | Number of items in the Redis daily spend update queue. These are the aggregate spend logs for each user. | Redis |
litellm_redis_daily_end_user_spend_update_queue_size | Number of items in the Redis daily end user spend update queue. | Redis |
litellm_redis_daily_agent_spend_update_queue_size | Number of items in the Redis daily agent spend update queue. | Redis |
litellm_in_memory_spend_update_queue_size | In-memory aggregate spend values for keys, users, teams, team members, etc. | In-Memory |
litellm_redis_spend_update_queue_size | Redis aggregate spend values for keys, users, teams, etc. | Redis |
LiteLLM Maintained Grafana Dashboards
LiteLLM maintains two Grafana dashboards for the litellm_* metrics on this page, both in the cookbook/litellm_proxy_server/grafana_dashboard folder. Import the JSON from Dashboards > New > Import and pick your Prometheus data source when prompted
The All Prometheus Metrics dashboard has a panel for every metric in the tables above, grouped by theme: traffic, latency, spend and tokens, cache, deployments, rate limits, budgets, guardrails, MCP, managed files and batches, users and teams, plus the prometheus_system service metrics and DB transaction queue sizes. Panels for features you have not enabled stay empty; its readme lists which setting each row needs
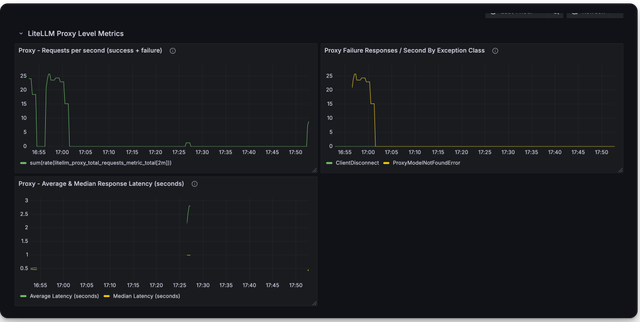
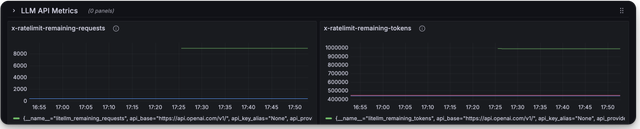
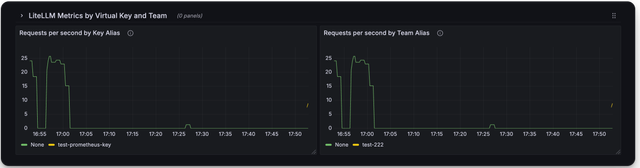
The v2 dashboard is a compact view of request rate, failures, latency and the remaining-request and remaining-token gauges per model group, shown below
Deprecated Metrics
| Metric Name | Description |
|---|---|
litellm_llm_api_failed_requests_metric | deprecated use litellm_proxy_failed_requests_metric |
Authentication on /metrics endpoint
By default, /metrics requires LiteLLM API key authentication (since v1.85.0).
For Prometheus, add authorization to your scrape config:
scrape_configs:
  - job_name: 'litellm'
    authorization:
      type: Bearer
      credentials: <LITELLM_API_KEY>
    static_configs:
      - targets: ['localhost:4000']
To allow unauthenticated access:
litellm_settings:
  require_auth_for_metrics_endpoint: false
FAQ
What are _created vs. _total metrics?
The Python Prometheus client emits a _created sample alongside every counter and histogram. It holds the unix timestamp of when that series was created (typically process start, or the first time that label combination was seen), and it never counts anything.
You should consume the _total metrics for your counting purposes