Announcing Componentized Deployments

Last Updated: May 2026
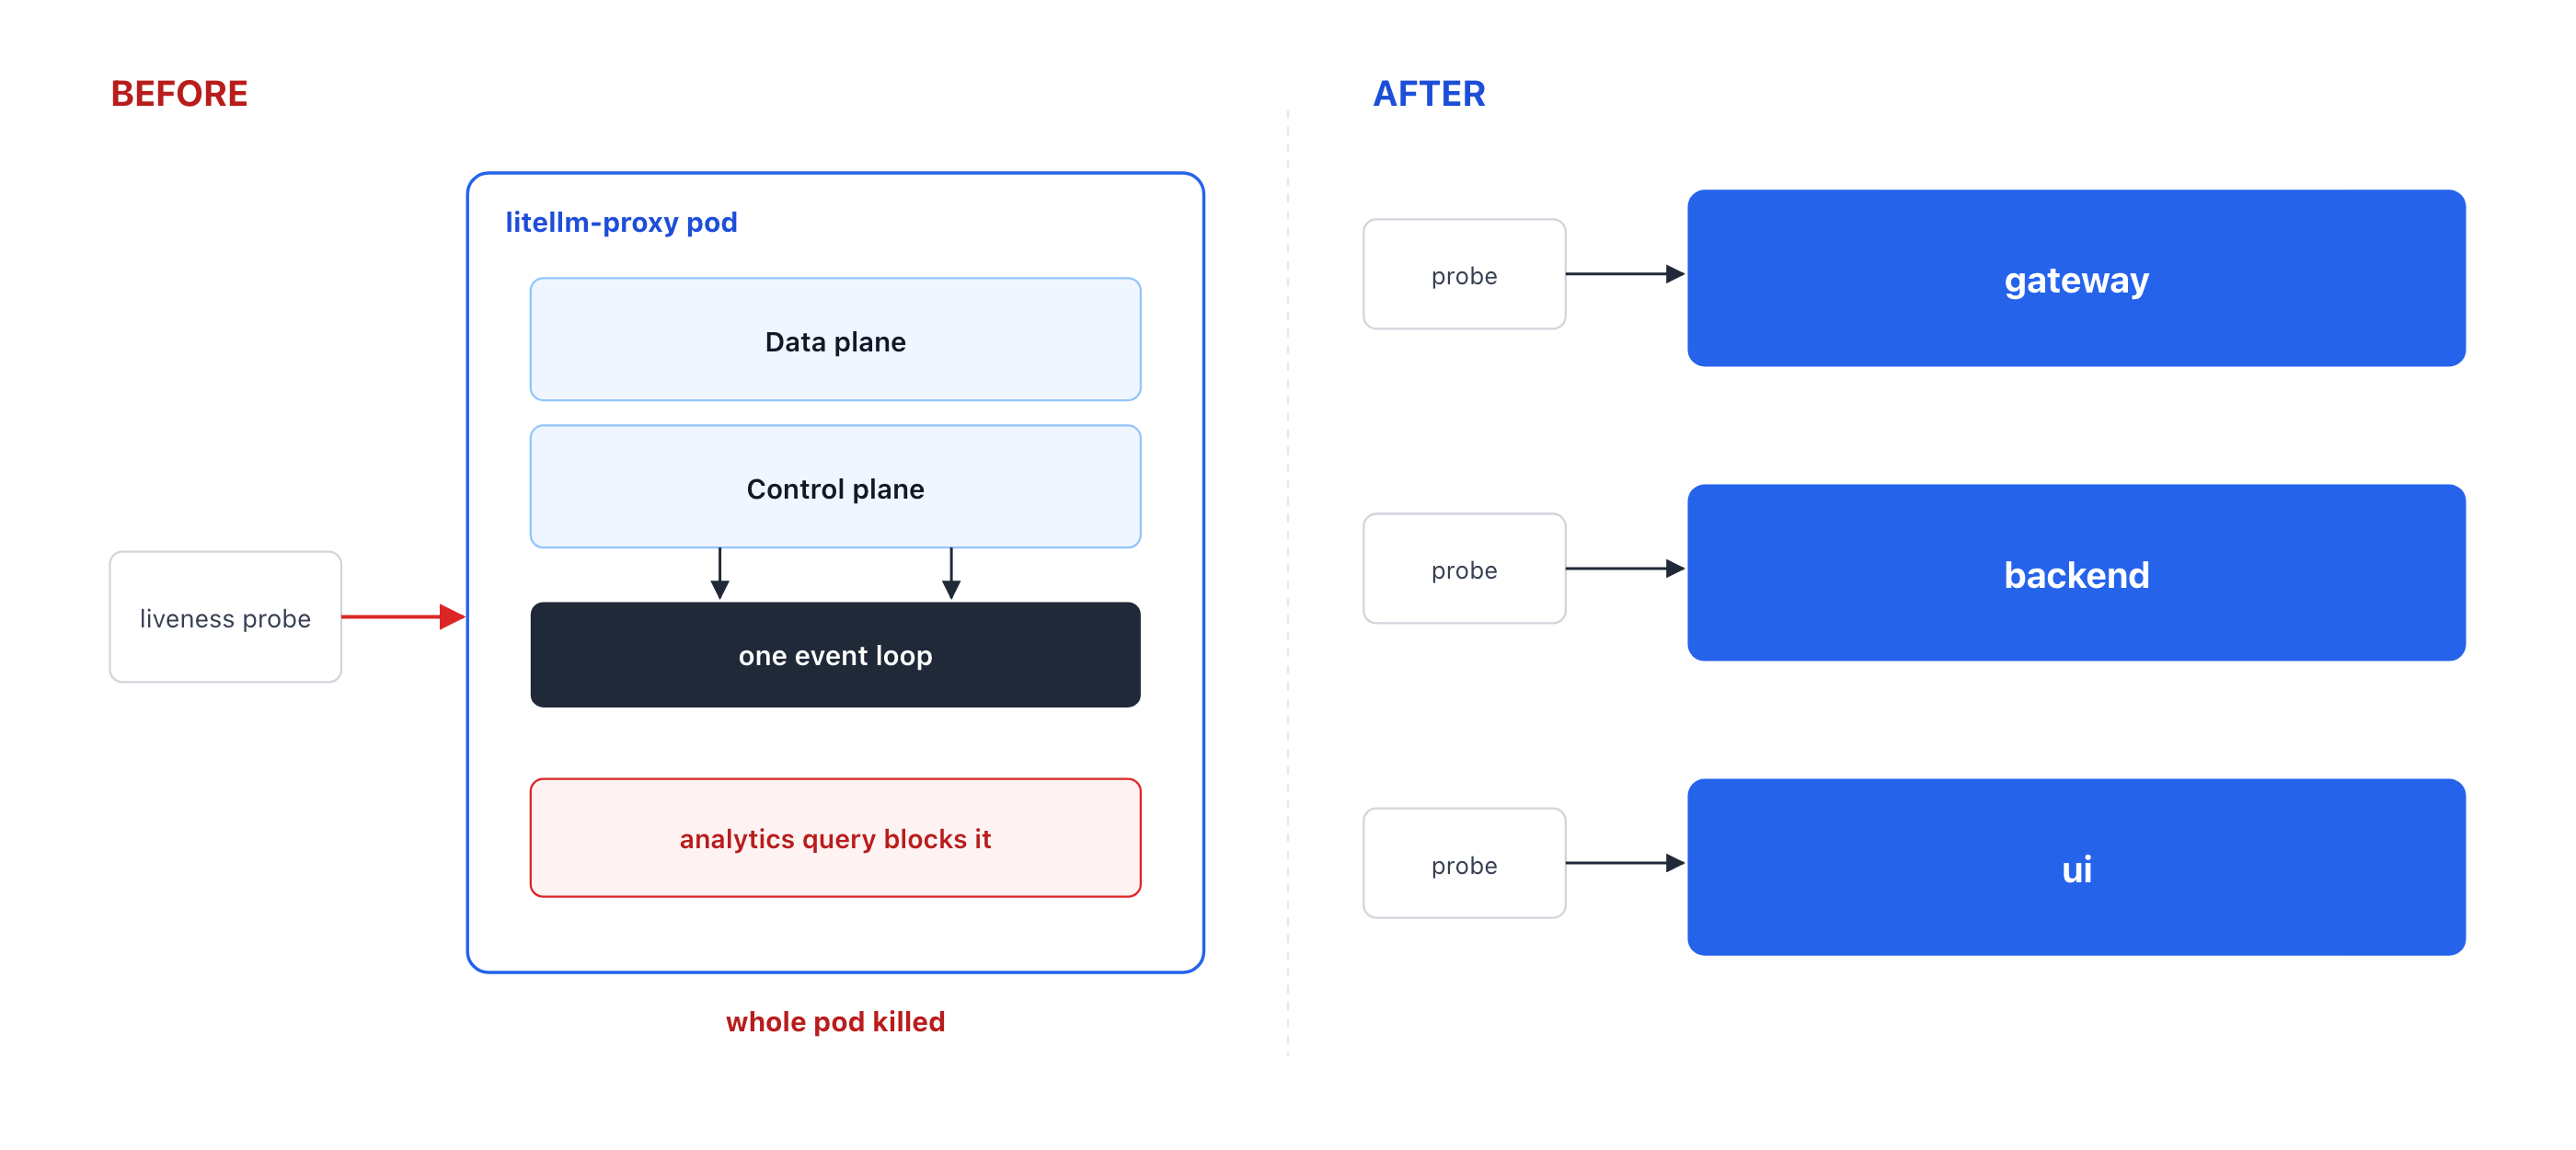
The LiteLLM proxy container does 2 very different things. It's an LLM data plane, /chat/completions, /v1/messages, embeddings, passthroughs, where latency is measured in single-digit milliseconds of overhead and traffic is high-volume and bursty. It's also a management control plane — keys, teams, SSO, audit logs, and the spend/usage analytics that power the dashboard, where a single request can scan millions of rows.
Run both on the same event loop, and the slowest thing the control plane does sets the reliability floor for the fastest thing the data plane does. This post is about how we've improved LiteLLM's reliability at scale by offering a componentized deployment model.
Example incident
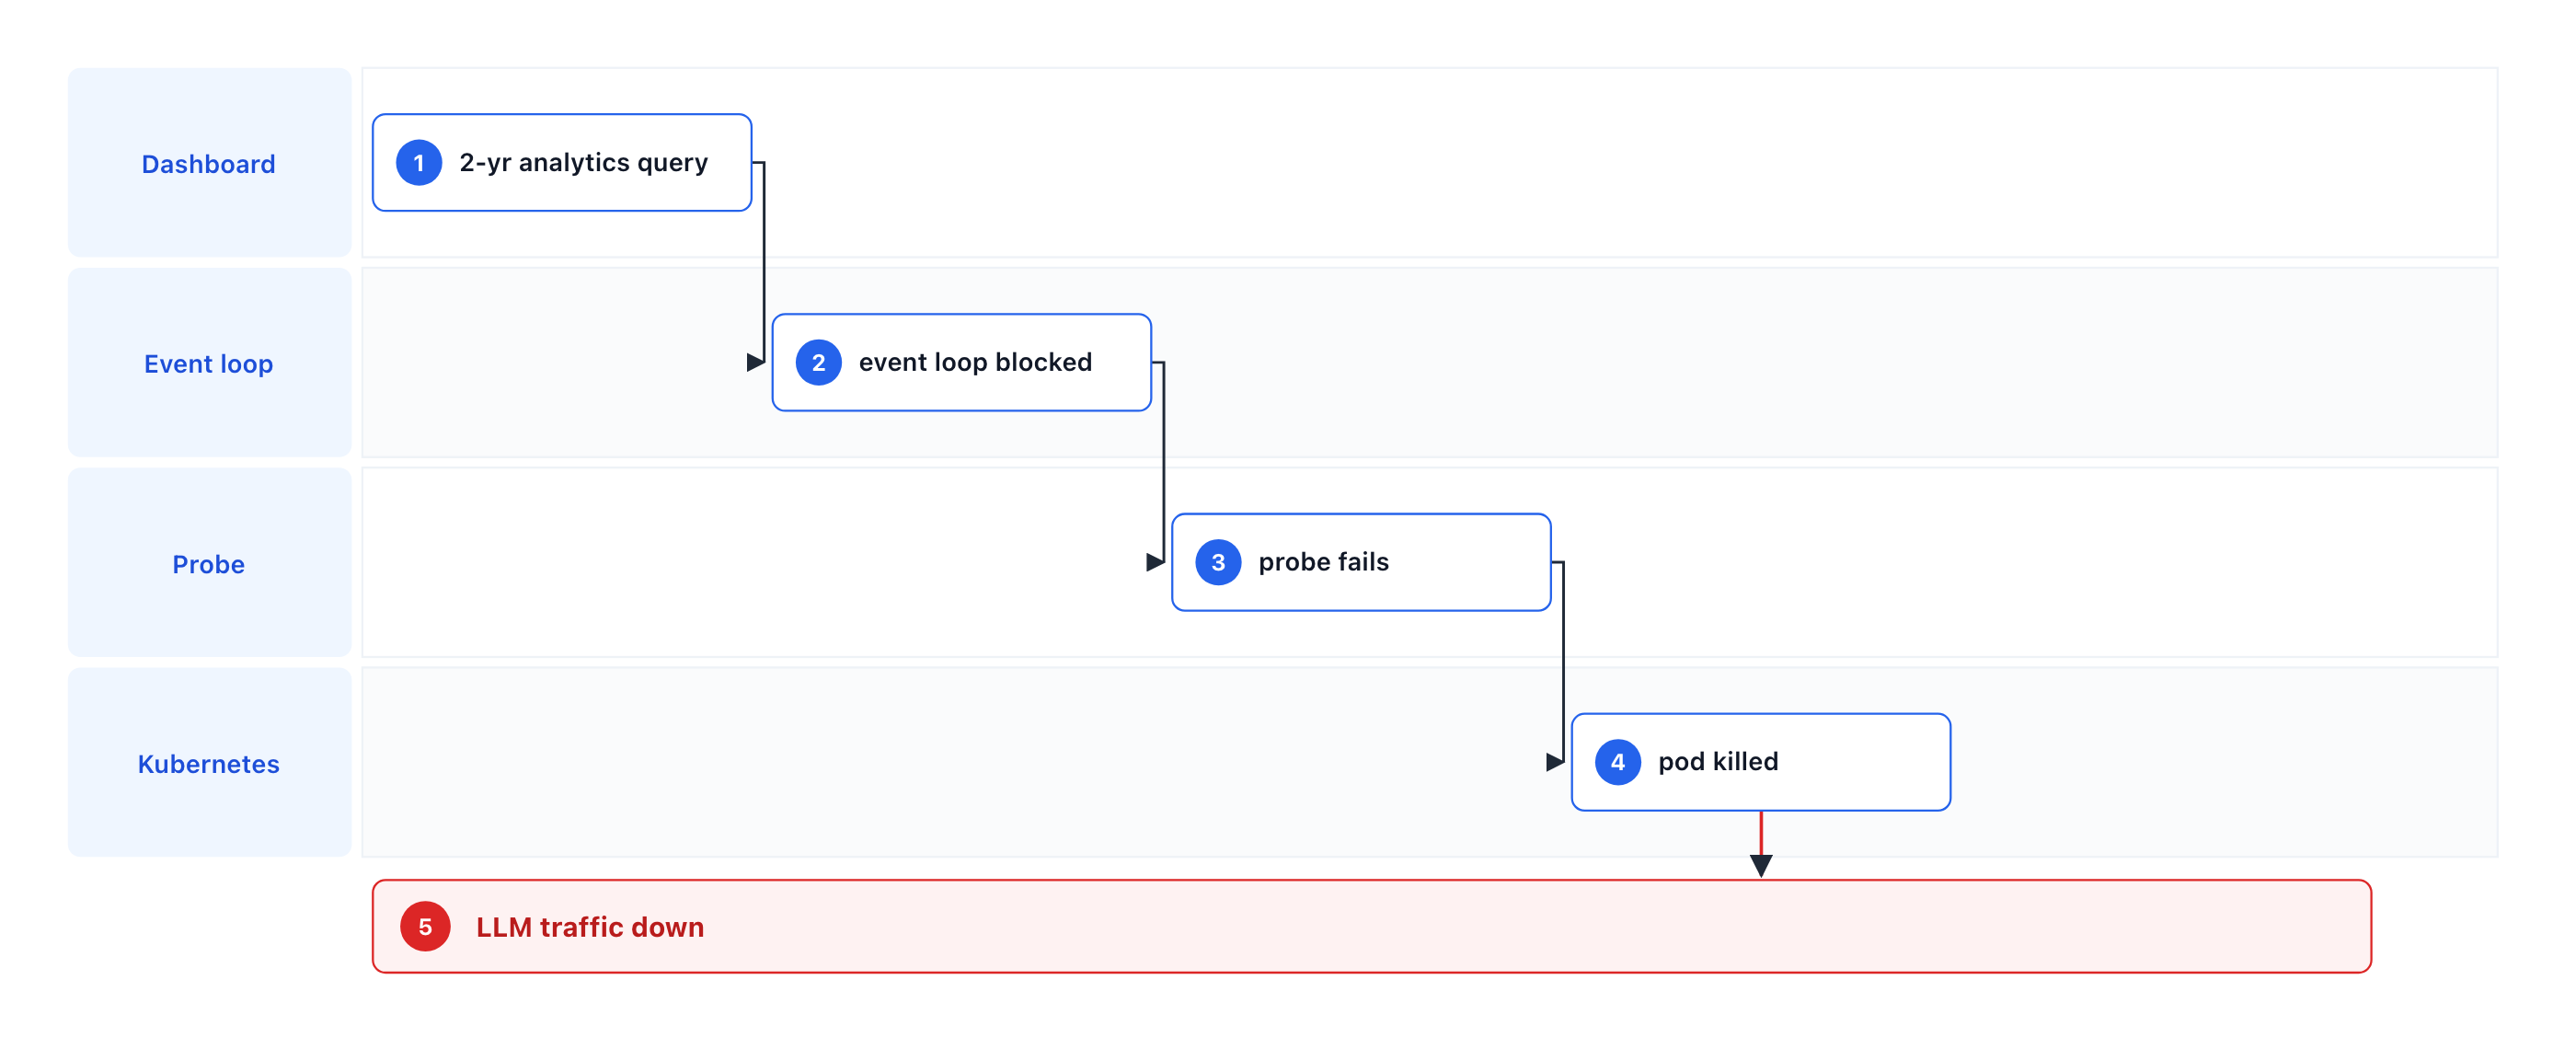
Here is an example incident we've seen in production deployments.
An enterprise team runs the gateway on Kubernetes with two replicas. Their dashboard issues a usage-analytics request over a two-year date range. Server-side, that expands into an aggregation over roughly 730 distinct days, multiplied across users, keys, and models, with significant work being done in-process.
That aggregation runs on the same asyncio event loop that serves everything else, including the gateway and health endpoints. While the loop is busy stitching the result together, it cannot answer /v1/messages or /health/liveliness in time. Kubernetes marks the probe failed and terminates the pod.
Why one container is the problem
Code optimizations were necessary to address the example incident. But, as long as a single container serves both the control plane and the data plane, any sufficiently expensive control plane operation is a latent liveness failure for the data plane:
- Shared event loop. One CPU-bound aggregation pass blocks every coroutine, including the data plane.
- Shared health check. Kubernetes can only see one process. It can't tell "the analytics endpoint is slow" from "this pod is dead," so it kills the pod — and the inference traffic with it.
- Shared scaling unit. You can only scale the whole thing. Provisioning replicas for a bursty analytics dashboard means over-provisioning the data plane, and vice versa.
- Shared database connection pressure. Heavy analytical reads contend with the spend-tracking writes on the same connections.
The componentized deployment
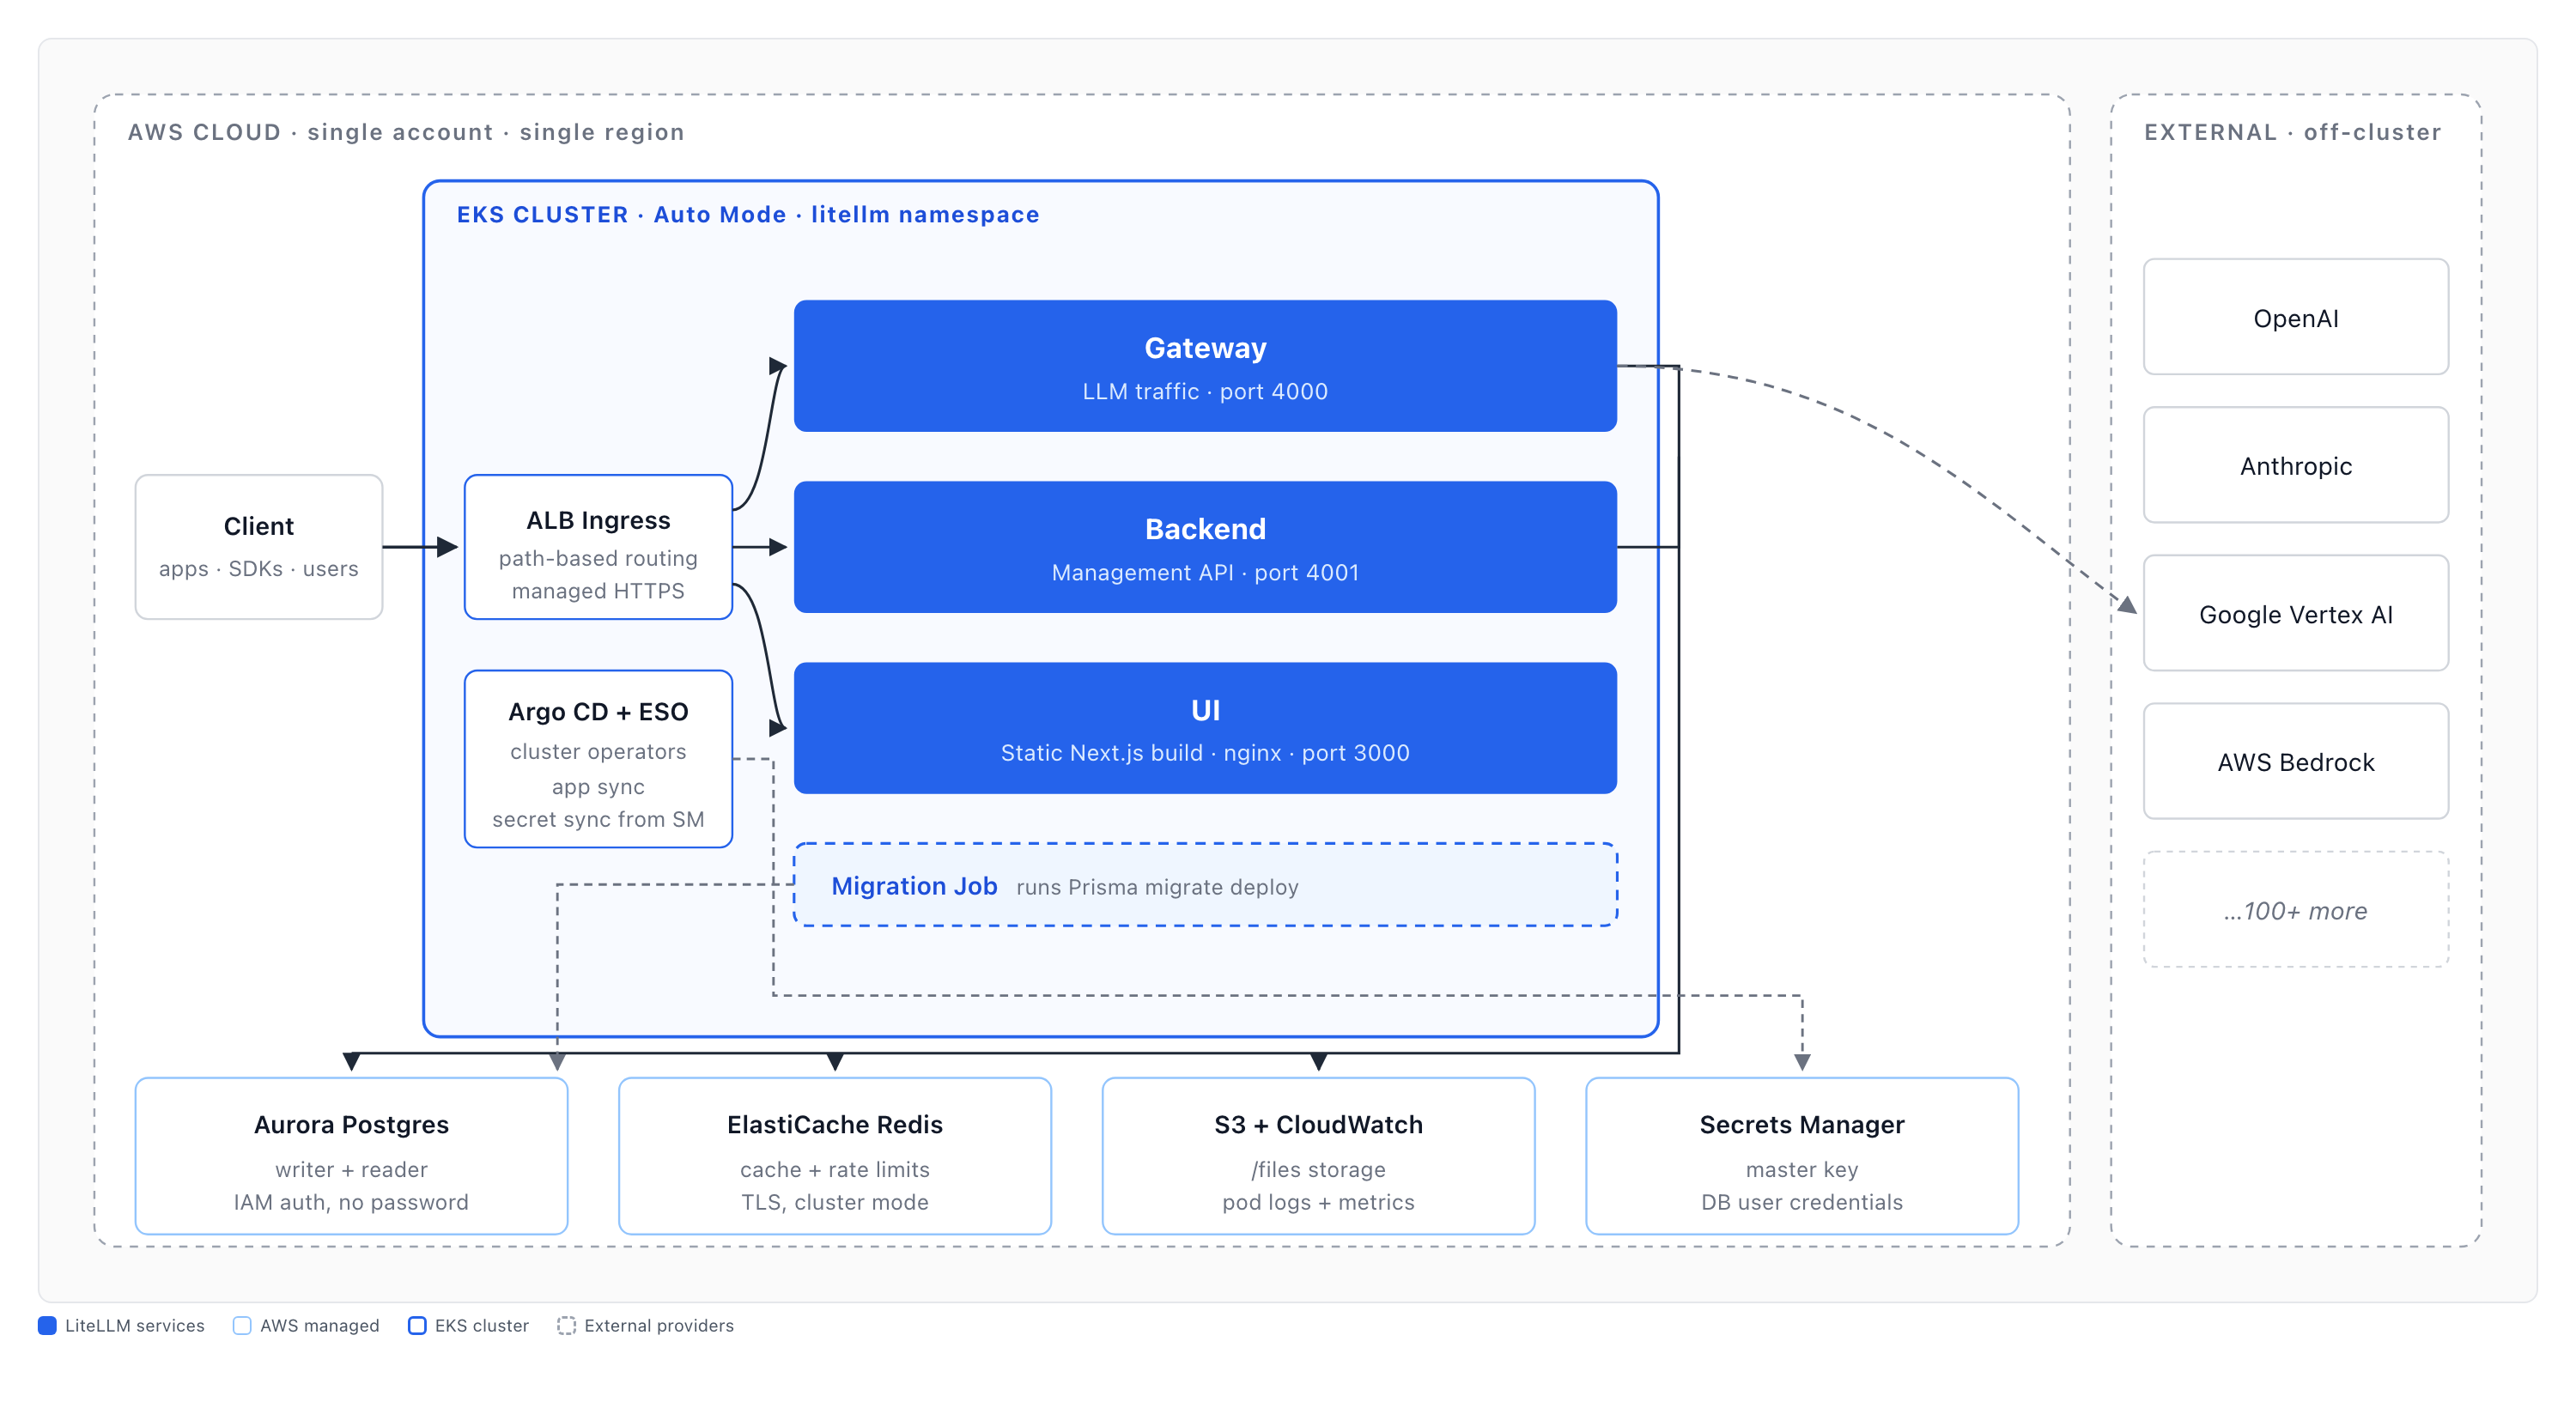
LiteLLM now offers an experimental Helm chart that runs LiteLLM as three independent microservices plus a one-shot migrations Job.
| Component | Port | Surface |
|---|---|---|
| gateway | 4000 | LLM data plane — /chat/completions, /v1/messages, embeddings, audio, batches, passthroughs, /health, /metrics |
| backend | 4001 | Management/UI API — keys, users, teams, orgs, SSO, audit logs, spend & usage analytics |
| ui | 3000 | Next.js dashboard, static export served by nginx |
| migrations | Job | prisma migrate deploy, run once as a pre-install/pre-upgrade Helm hook |
Each service scales independently and has its own health checks. An Ingress fronts all three: data-plane path prefixes route to the gateway, UI assets to the nginx pods, and everything else (the management API) to the backend.
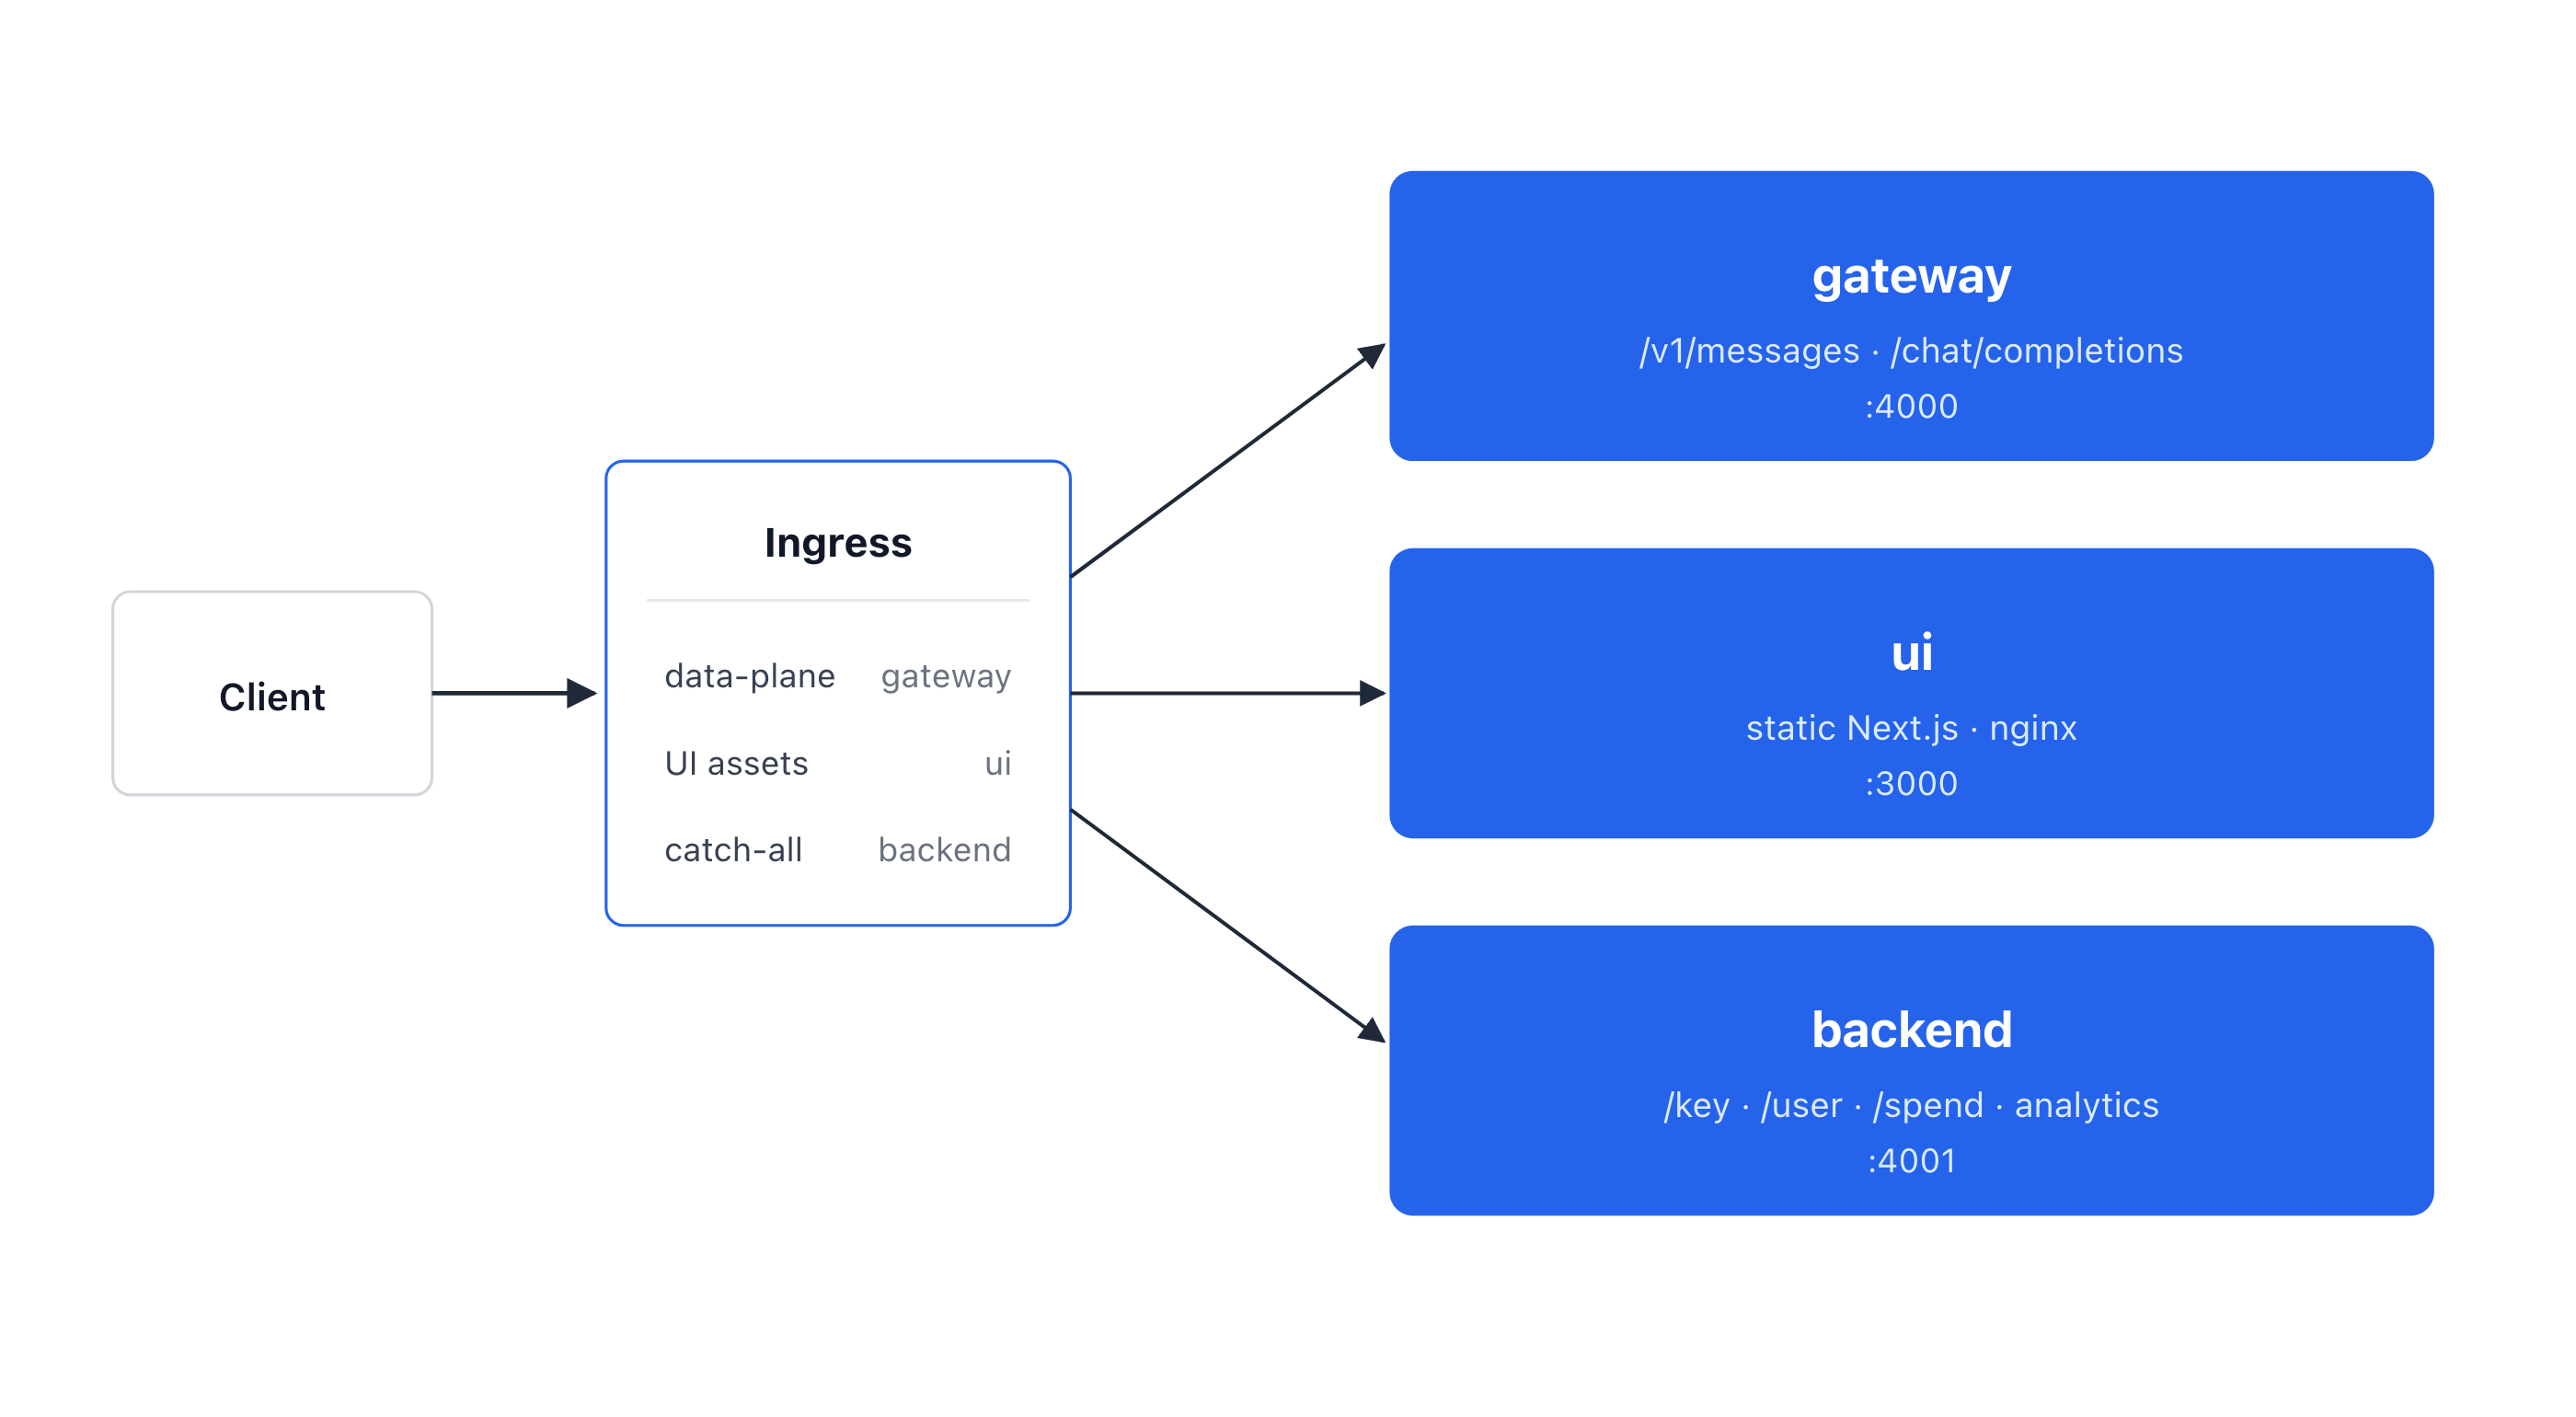
Replaying the incident on this topology: the analytics request is a management path, so the Ingress routes it to the backend pods. The heavy aggregation can now only block the backend's event loop. The gateway pods never see that request, keep answering their own /health/liveliness, and keep serving /v1/messages. If the backend does fall over, Kubernetes recycles only the backend, and the data plane stays up. The blast radius is contained.
Independent scaling, independent health
Because each component is its own Deployment with its own HPA, you size them for their actual load profiles instead of the worst case of their union:
gateway:
  hpa: { enabled: true, minReplicas: 1, maxReplicas: 10,
         targetCPUUtilizationPercentage: 70 }
backend:
  hpa: { enabled: true, minReplicas: 1, maxReplicas: 4,
         targetCPUUtilizationPercentage: 70 }
The dashboard-driven backend scales on its own, and the high-throughput gateway scales on its own. Neither steals headroom from the other, and a probe failure on one never recycles the other.
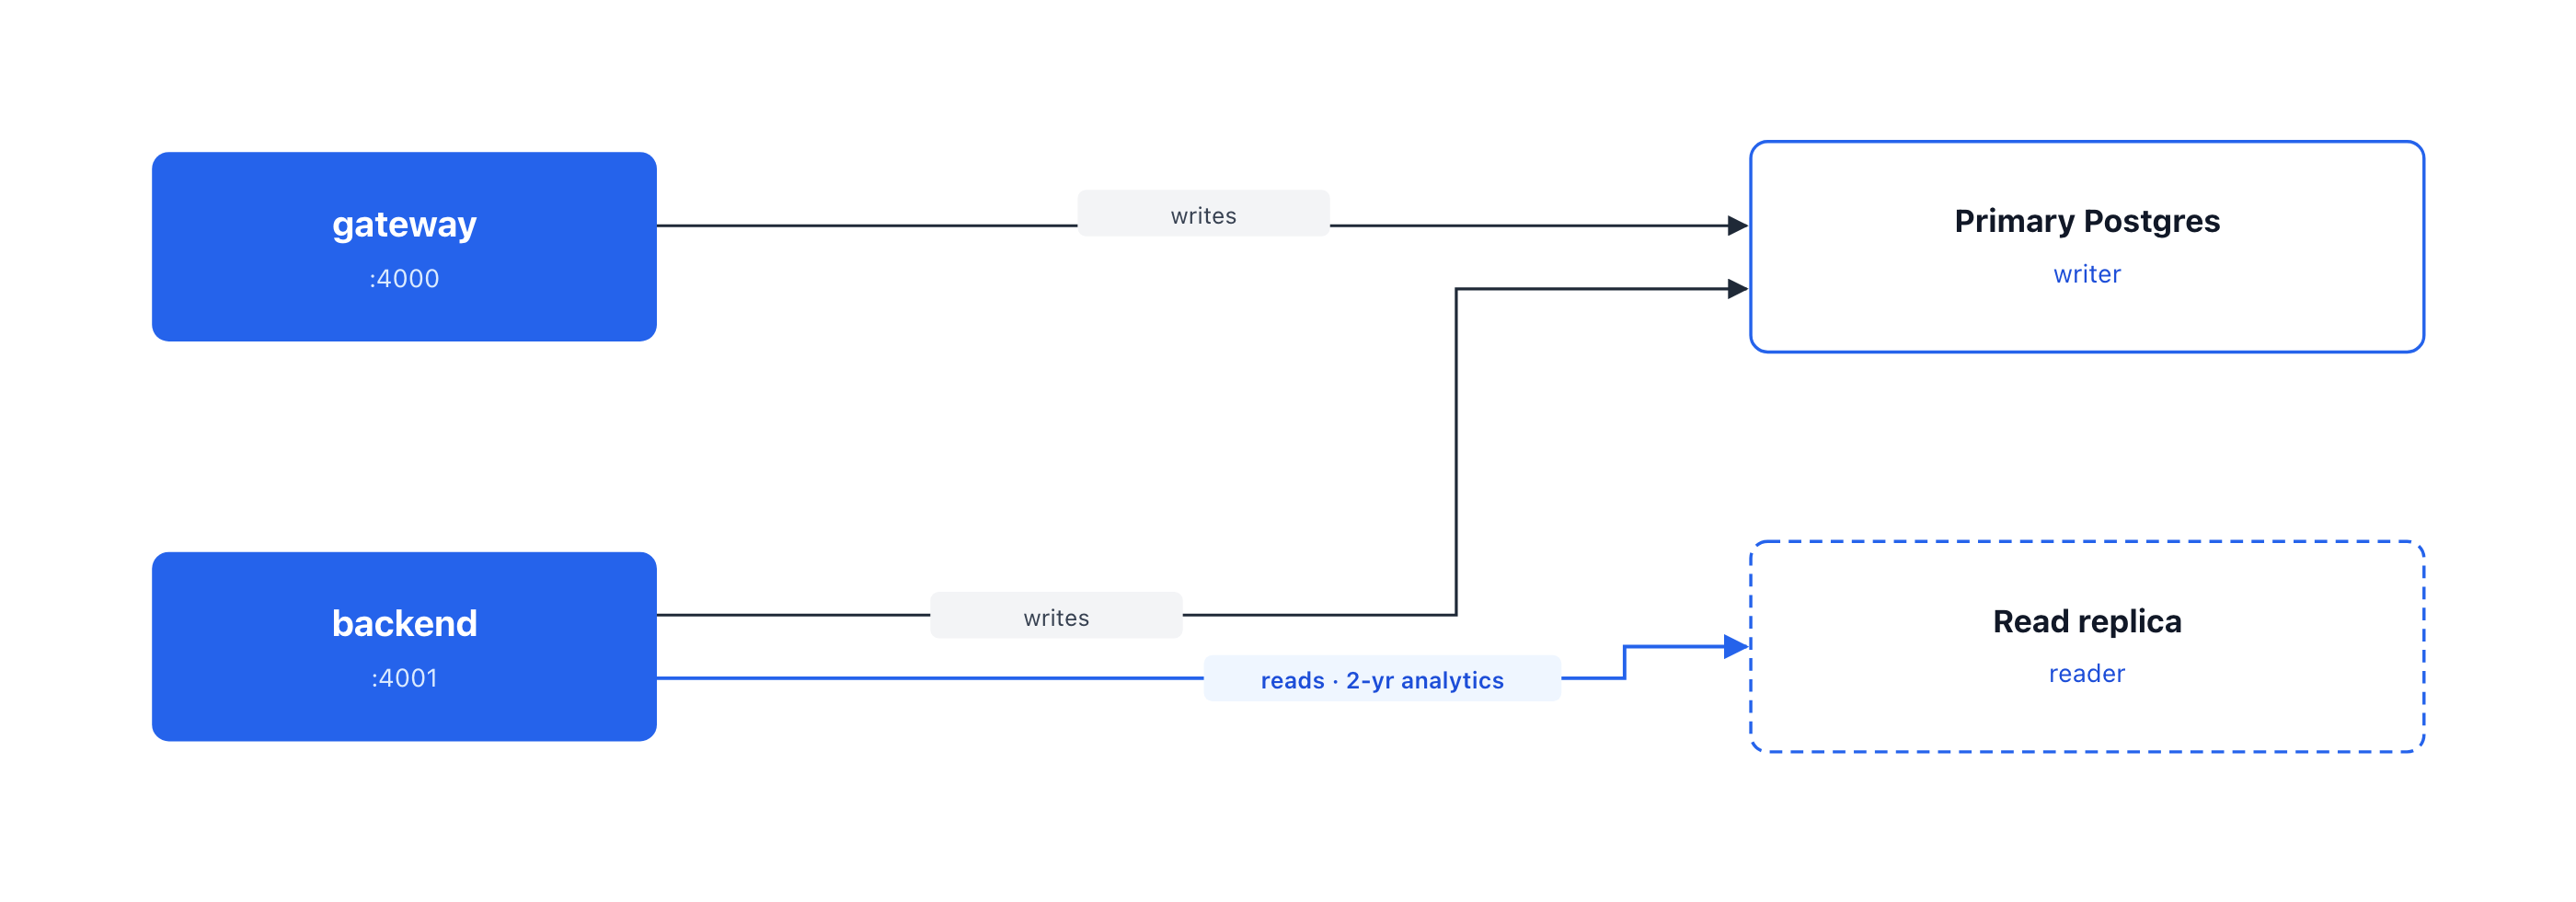
Offloading heavy reads to a replica
The componentized deployment also supports an optional read replica. When a reader endpoint is configured, read-heavy operations (find_*, count, group_by, raw read queries) route to the read replica while writes are routed to the primary.
This isolates expensive read queries from the connection pool that the spend-tracking writes depend on. The update_spend background job stops backing up under analytics load.
Using the experimental Helm chart
The componentized deployment ships as an OCI Helm chart published to GitHub Container Registry: ghcr.io/berriai/litellm/chart/litellm.
This chart is experimental and the values schema may change between releases. Pin --version and review the diff before upgrading. The single-image deployment remains the supported default.
Sensitive values are passed by Secret reference only — create them first:
kubectl create namespace litellm

kubectl -n litellm create secret generic litellm-master-key-secret \
  --from-literal=master-key="sk-..."

kubectl -n litellm create secret generic litellm-writer-secret \
  --from-literal=username=litellm --from-literal=password="..."

kubectl -n litellm create secret generic litellm-reader-secret \
  --from-literal=username=litellm --from-literal=password="..."
Then install (or helm upgrade --install) straight from the OCI registry:
helm upgrade --install litellm \
  oci://ghcr.io/berriai/litellm/chart/litellm \
  --version 1.86.0-dev \
  -n litellm \
  -f values.yaml
The chart runs prisma migrate deploy as a pre-install/pre-upgrade hook Job, then brings up the gateway, backend, and ui Deployments. Set ingress.enabled=true to front all three behind one host (data-plane prefixes → gateway, UI assets → ui, catch-all → backend).
Separate read and write databases
Routing the heavy analytics reads off the writer is just the database.reader block. Set reader.host to enable it; leave it empty and every query goes to the writer.
# values.yaml
masterKey:
  secretName: litellm-master-key-secret   # Secret holding the proxy master key
  secretKey: master-key

database:
  # Writer — all writes (spend logs, tokens, config) land here
  writer:
    host: litellm-pg-rw.litellm.svc
    port: 5432
    dbname: litellm
    passwordSecret:
      name: litellm-writer-secret
      usernameKey: username
      passwordKey: password

  # Reader — set reader.host to route read-heavy ops
  # (find_*, count, group_by, raw reads) to the replica.
  # Unset reader fields fall back to the writer's values.
  reader:
    host: litellm-pg-ro.litellm.svc
    port: 5432
    dbname: litellm
    passwordSecret:
      name: litellm-reader-secret
      usernameKey: username
      passwordKey: password
Key takeaways
- A monolithic proxy gives the control plane and the data plane shared fate: one slow management query can fail the liveness probe and recycle the pods serving inference.
- The componentized Helm chart runs LiteLLM as three microservices: gateway, backend, ui + a one-shot migrations Job.
- Each component has its own probes and its own HPA, so a failure or a load spike is contained to the surface that caused it.
- An optional read replica isolates heavy backend analytics reads from spend-tracking writes on the primary.
Conclusion
Part of reliability at scale is about controlling blast radius. A heavy dashboard query is a normal thing for a control plane to do; it should never bring down pods serving model traffic. Splitting LiteLLM into microservices ensures that downtime is contained to the surface that caused it.