Parseable
Parseable provides setup guides for the LiteLLM SDK and LiteLLM Gateway.
Overview
Send LiteLLM traces, logs and metrics to Parseable with OpenTelemetry. The SDK integration records telemetry from Python applications that call LiteLLM. The Gateway integration records gateway traces and Prometheus metrics for routing, failures, spend, token usage, rate limits and infrastructure dependencies.
Both integrations send telemetry through an OpenTelemetry Collector. The Collector stores Parseable credentials and routes traces, logs and metrics to separate datasets.
Prerequisites
You need a running Parseable instance, a Parseable API key with ingest access, an OpenTelemetry Collector that LiteLLM can reach and a model provider API key.
Monitoring LiteLLM
Choose the LiteLLM SDK when your Python application imports and calls LiteLLM. Choose the LiteLLM Gateway when applications send requests through a central LiteLLM endpoint.
- LiteLLM SDK
- LiteLLM Gateway
Create separate Parseable datasets for traces, logs and metrics, then configure the OpenTelemetry Collector to forward each signal. See the Parseable LiteLLM SDK guide for dataset and Collector configuration.
- No Code (Recommended)
- Code
Step 1: Install LiteLLM and the OpenTelemetry packages.
pip install litellm \
  opentelemetry-api \
  opentelemetry-sdk \
  opentelemetry-exporter-otlp
Step 2: Enable the OpenTelemetry callback before making LiteLLM calls.
import litellm

litellm.callbacks = ["otel"]
Step 3: Point LiteLLM at the OpenTelemetry Collector.
export OTEL_EXPORTER="otlp_http"
export OTEL_ENDPOINT="http://localhost:4318"
export OTEL_SERVICE_NAME="litellm-sdk"
export LITELLM_OTEL_V2="true"
export LITELLM_OTEL_INTEGRATION_ENABLE_METRICS="true"
export LITELLM_OTEL_INTEGRATION_ENABLE_EVENTS="true"
export USE_OTEL_LITELLM_REQUEST_SPAN="true"
export OTEL_SEMCONV_STABILITY_OPT_IN="gen_ai_latest_experimental"
export OTEL_INSTRUMENTATION_GENAI_CAPTURE_MESSAGE_CONTENT="no_content"
LITELLM_OTEL_INTEGRATION_ENABLE_EVENTS exports GenAI events as logs. USE_OTEL_LITELLM_REQUEST_SPAN and OTEL_SEMCONV_STABILITY_OPT_IN create the CLIENT spans used by the Parseable dashboard queries.
Step 4: Run the application.
import litellm

litellm.callbacks = ["otel"]

response = litellm.completion(
    model="openai/gpt-6-luna",
    messages=[{"role": "user", "content": "What is observability?"}],
)

print(response.choices[0].message.content)
Use code-based configuration when you need to enable GenAI events and metrics or control message capture and semantic convention settings.
Step 1: Install LiteLLM and the OpenTelemetry packages.
pip install litellm \
  opentelemetry-api \
  opentelemetry-sdk \
  opentelemetry-exporter-otlp
Step 2: Configure the LiteLLM OpenTelemetry callback.
import litellm

litellm.callbacks = ["otel"]
Step 3: Make a LiteLLM request.
response = litellm.completion(
    model="openai/gpt-6-luna",
    messages=[
        {"role": "user", "content": "Explain distributed tracing."}
    ],
    metadata={"mask_input": True, "mask_output": True},
)

print(response.choices[0].message.content)
USE_OTEL_LITELLM_REQUEST_SPAN=true creates a model-call span for each SDK request. OTEL_INSTRUMENTATION_GENAI_CAPTURE_MESSAGE_CONTENT="no_content" and request-level masking keep raw prompts and responses out of exported telemetry.
View Traces, Logs and Metrics in Parseable
Open <sdk-traces-dataset> from the Traces page, <sdk-logs-dataset> from the Logs page and <sdk-metrics-dataset> from the Metrics page. SDK metrics include request duration, token usage, cost and streaming latency.
The Parseable SDK guide provides Collector pipelines, dataset headers, SQL queries and troubleshooting steps.
Dashboard
The LiteLLM SDK Observability dashboard contains 50 tiles across nine sections. Its SQL queries combine LiteLLM logs, traces and metrics to cover request health, latency, token usage, spend and telemetry quality.
Import the JSON template in Parseable. Set Logs Dataset to <sdk-logs-dataset>, Traces Dataset to <sdk-traces-dataset> and Metrics Dataset to <sdk-metrics-dataset>. Use the Service, Environment, Request Model, Provider and Log Level variables to filter dashboard tiles.
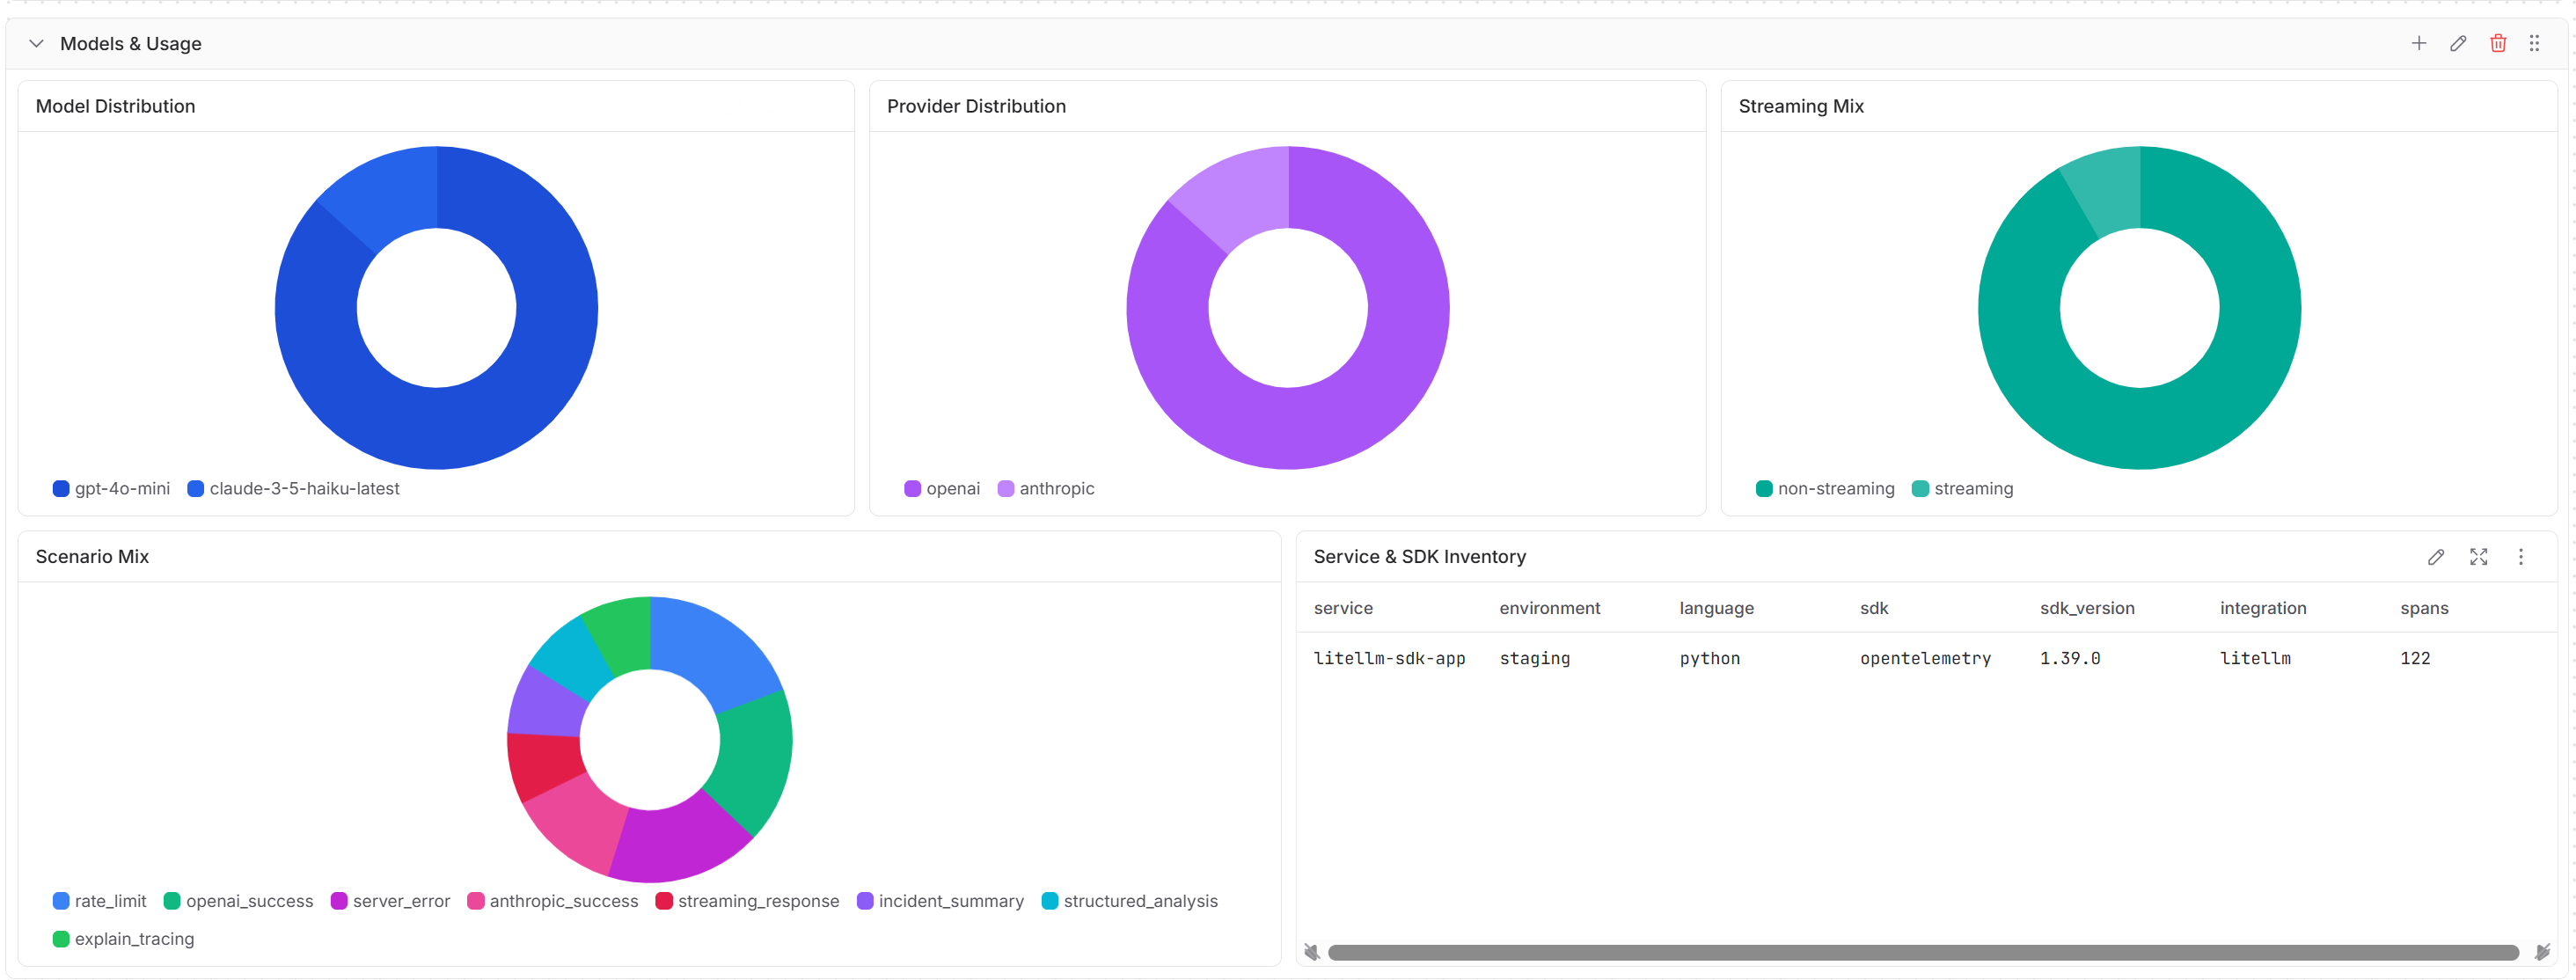
Models and usage
The Models and Usage section shows model and provider distribution, streaming usage, scenario distribution and SDK inventory. Use it to compare traffic across models and confirm which services and SDK versions produce telemetry.
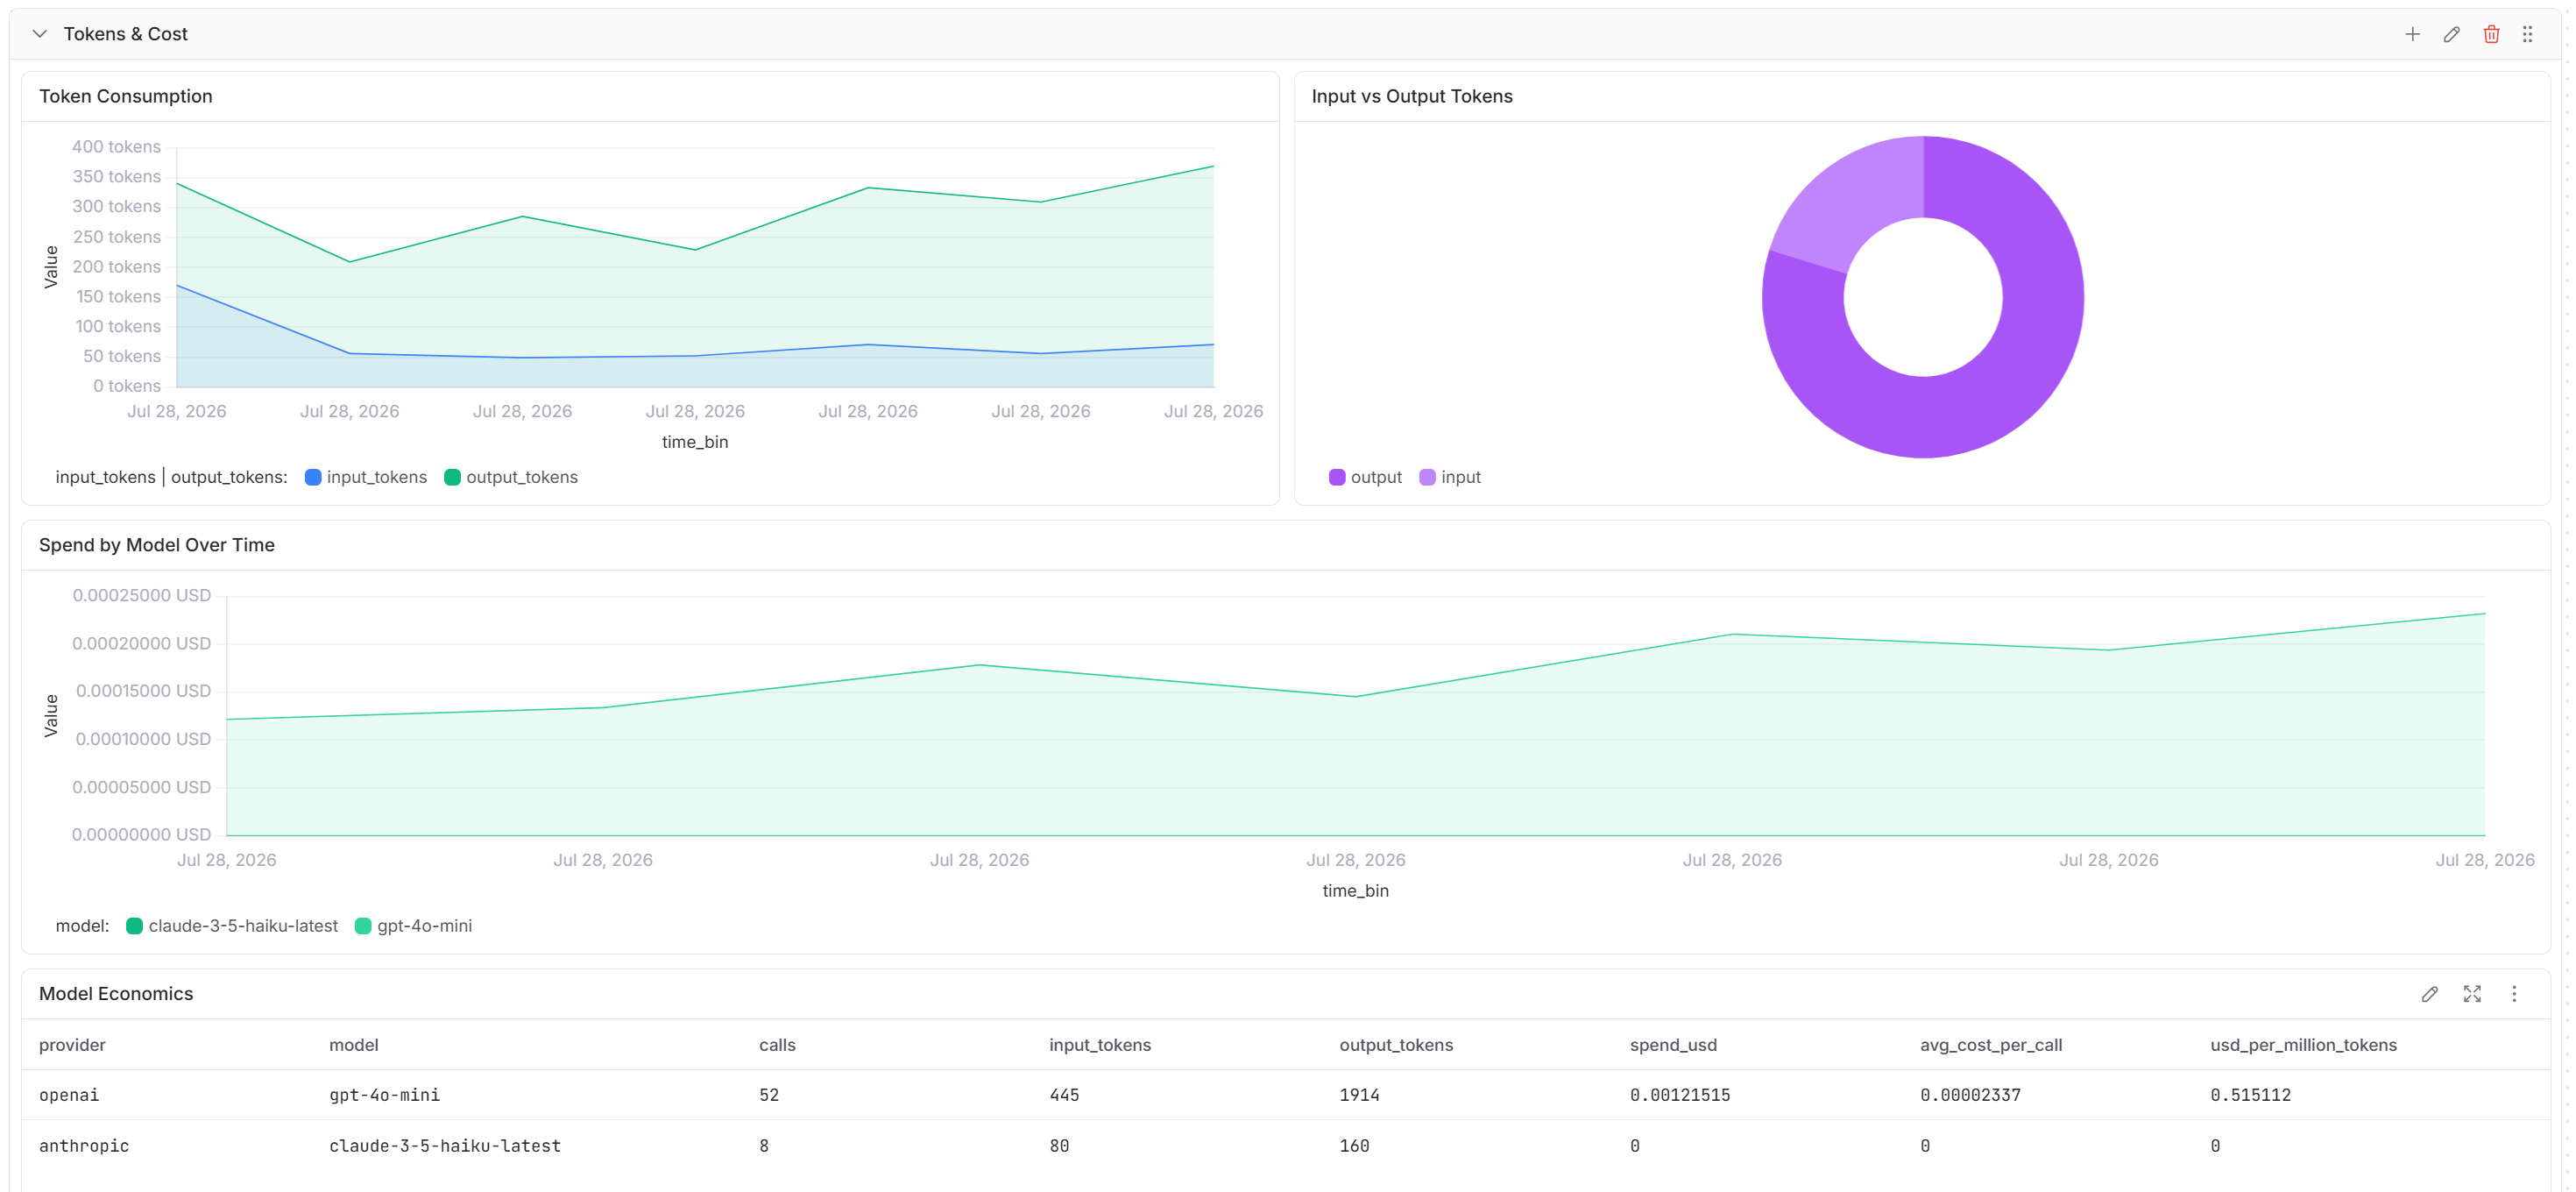
Tokens and cost
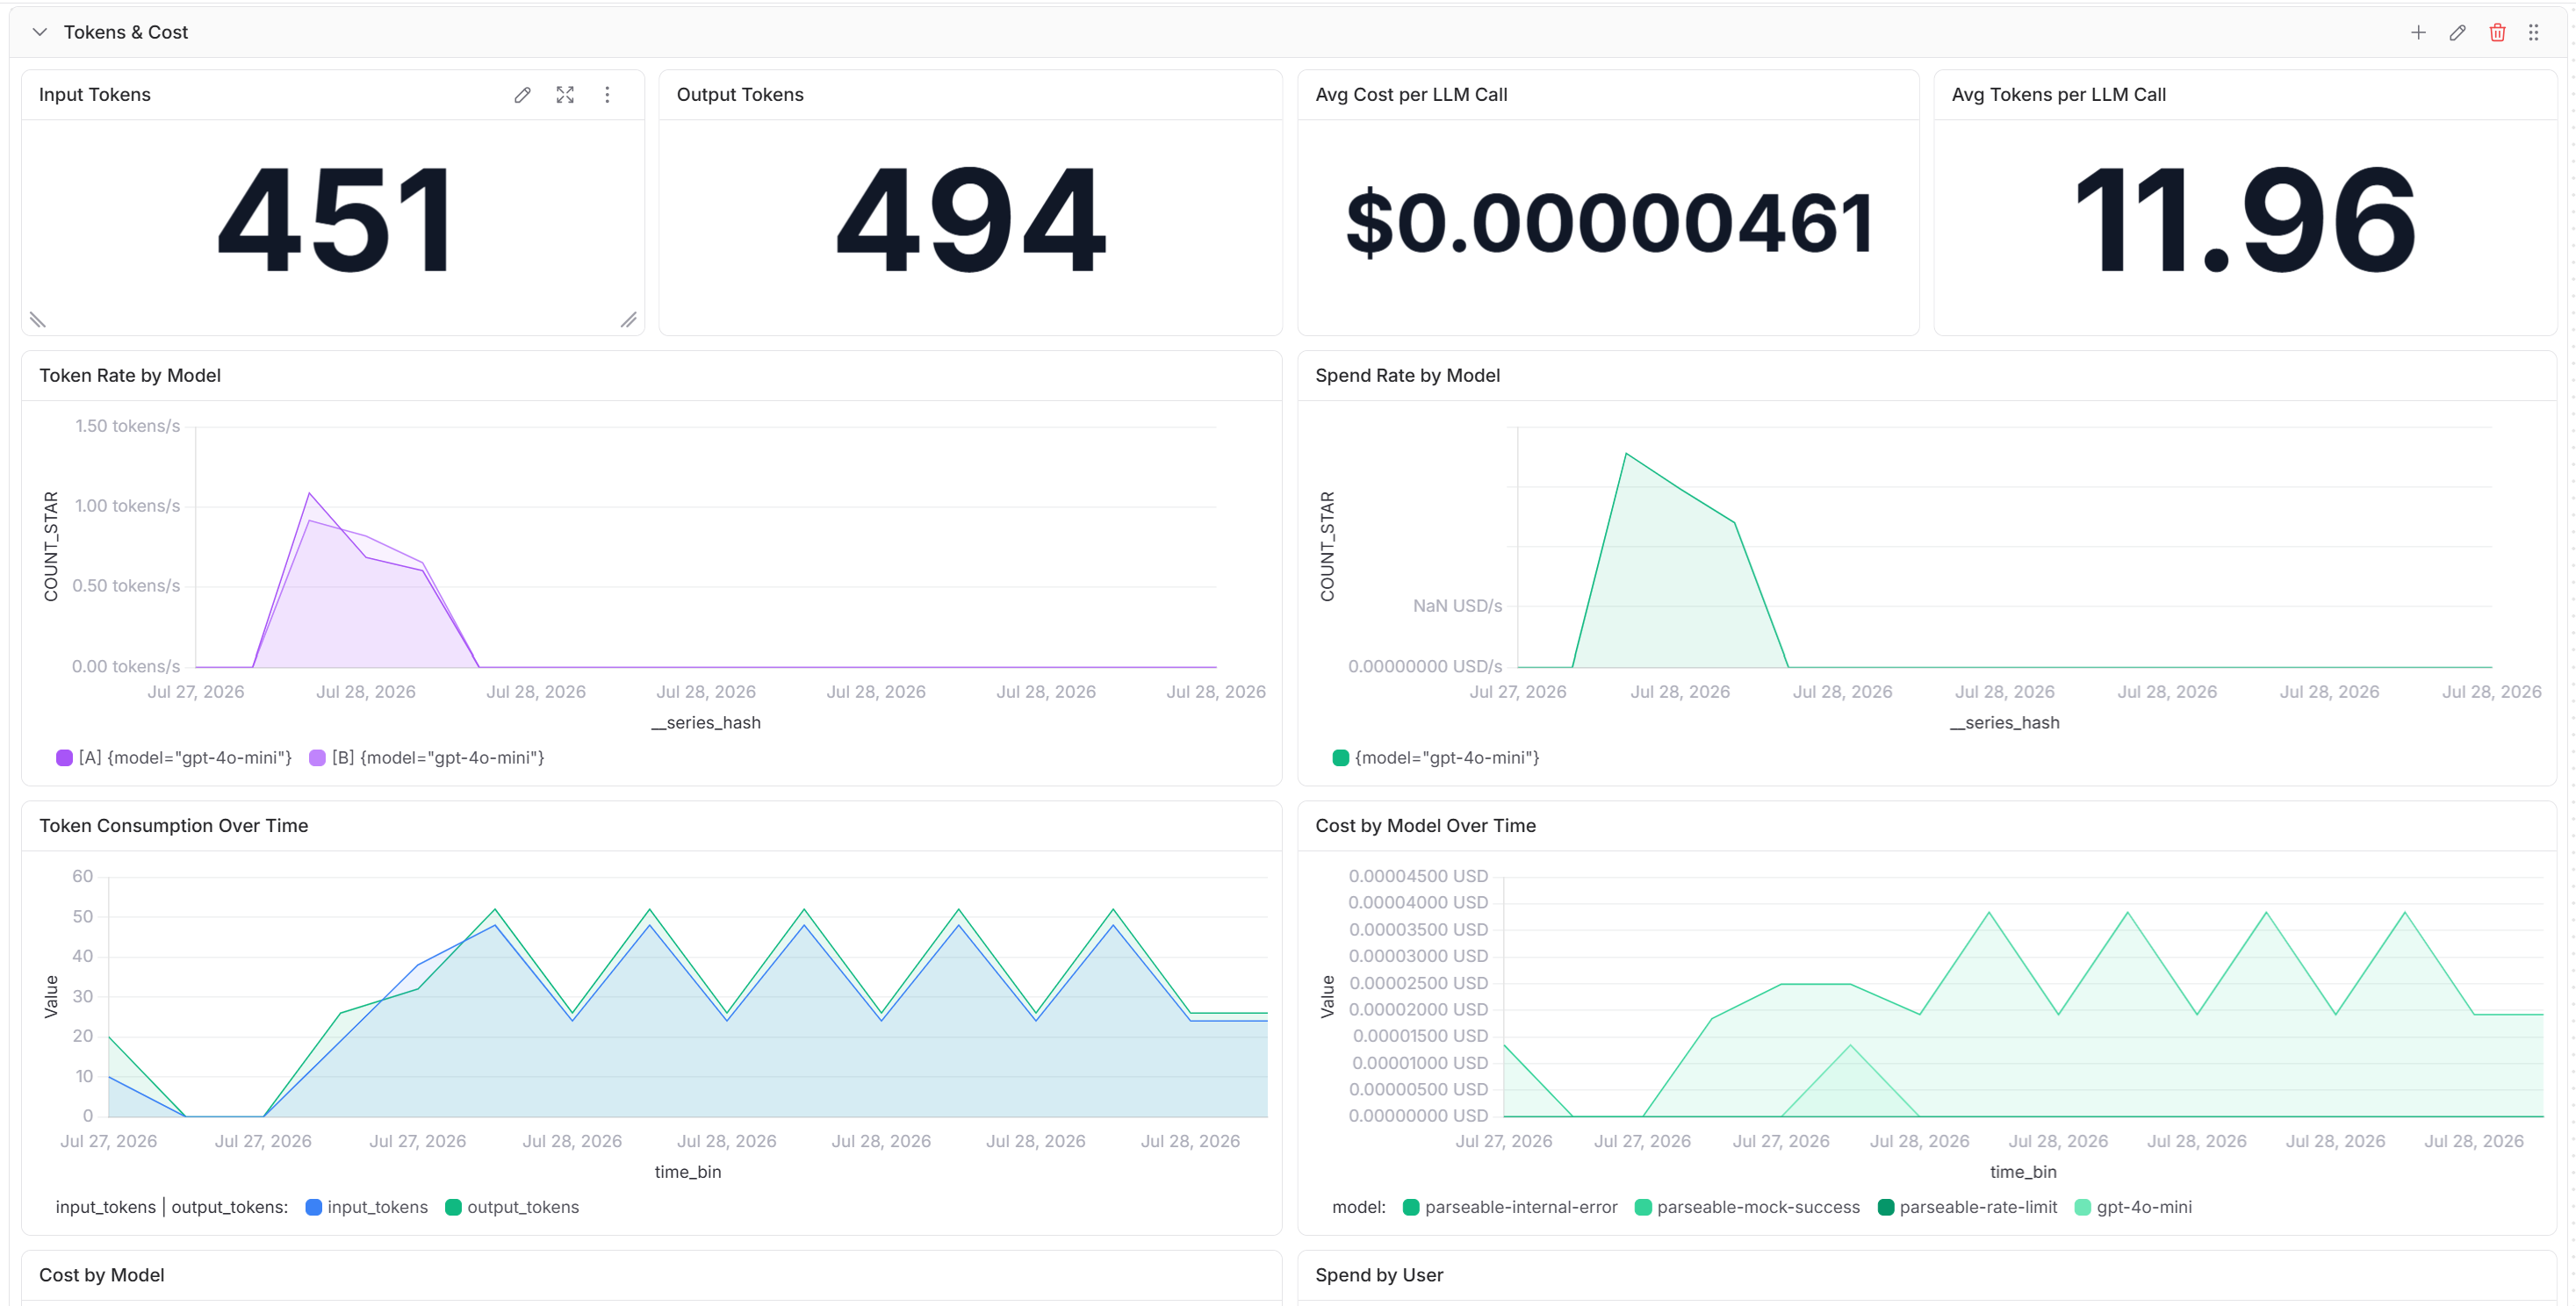
The Tokens and Cost section shows input and output token consumption, spend by model over time and model economics. Use it to find high-volume models and compare token volume with recorded spend.
The remaining sections cover Traffic and Reliability, Performance and Latency, Cost and FinOps, Logs, Trace Explorer and Metrics and Telemetry. See Parseable Dashboards for import and customization instructions.
The Gateway sends OpenTelemetry traces to the Collector and exposes gateway metrics at /metrics for the Collector to scrape. The Parseable LiteLLM Gateway guide provides dataset and Collector configuration.
Step 1: Install LiteLLM Gateway and the telemetry packages.
pip install "litellm[proxy]" \
  opentelemetry-api \
  opentelemetry-sdk \
  opentelemetry-exporter-otlp-proto-http \
  opentelemetry-instrumentation-fastapi \
  prometheus-client==0.20.0
Step 2: Enable OpenTelemetry and Prometheus callbacks in config.yaml.
litellm_settings:
  callbacks:
    - otel
    - prometheus

callback_settings:
  otel:
    attributes:
      exclude_list:
        - hidden_params
        - metadata.requester_metadata
        - metadata.requester_ip_address
        - metadata.spend_logs_metadata
        - metadata.mcp_tool_call_metadata
        - metadata.vector_store_request_metadata
        - metadata.prompt_management_metadata
The attribute exclusion list prevents request-specific metadata from creating high-cardinality metric series.
Step 3: Point LiteLLM at the OpenTelemetry Collector.
export LITELLM_MASTER_KEY="<litellm-master-key>"
export LITELLM_OTEL_V2="true"
export LITELLM_OTEL_INTEGRATION_ENABLE_METRICS="true"
export USE_OTEL_LITELLM_REQUEST_SPAN="true"
export OTEL_SEMCONV_STABILITY_OPT_IN="gen_ai_latest_experimental"
export OTEL_EXPORTER="otlp_http"
export OTEL_ENDPOINT="http://localhost:4318"
export OTEL_SERVICE_NAME="litellm-gateway"
export OTEL_ENVIRONMENT_NAME="production"
export OTEL_INSTRUMENTATION_GENAI_CAPTURE_MESSAGE_CONTENT="no_content"
Use the same LITELLM_MASTER_KEY in LiteLLM and the Collector's Prometheus receiver. The request-span and semantic-convention settings create the CLIENT spans used by the Parseable dashboard queries.
Step 4: Start the Gateway.
litellm --config config.yaml --port 4000
Configure the Collector to receive traces over OTLP/HTTP and scrape http://<litellm-host>:4000/metrics with the LiteLLM master key. Send traces to <gateway-traces-dataset> and metrics to <gateway-metrics-dataset> in Parseable.
View Traces and Metrics in Parseable
Open <gateway-traces-dataset> from the Traces page to inspect request paths, routing, guardrails, cache or database activity and provider calls. Open <gateway-metrics-dataset> from the Metrics page to inspect GenAI metrics and LiteLLM Prometheus metrics.
Dashboard
The LiteLLM Proxy Observability dashboard contains 52 tiles across seven sections. It combines SQL trace queries with PromQL gateway metrics to cover request health, latency, tokens, spend, model behavior and deployment health.
Import the JSON template in Parseable. Set Trace Dataset to <gateway-traces-dataset> and Metrics Dataset to <gateway-metrics-dataset>.
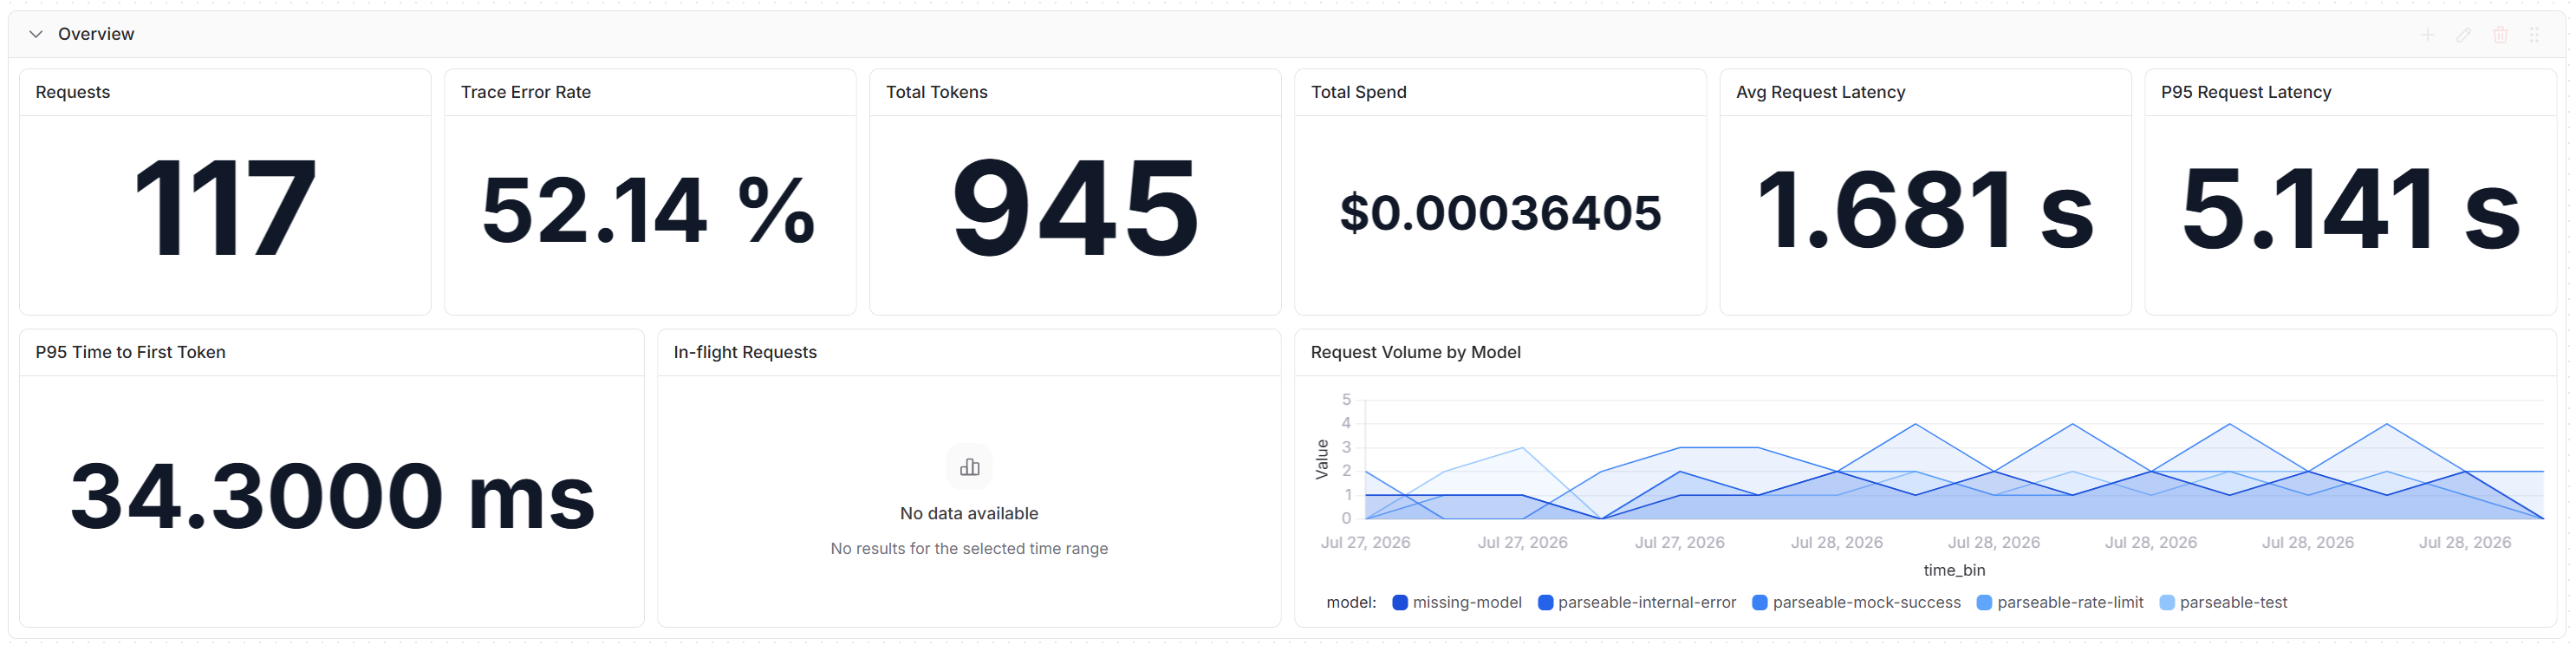
Gateway overview
The Overview section shows request count, trace error rate, total tokens, total spend, average request latency, P95 request latency and P95 time to first token. It includes panels for in-flight requests and request volume by model. Use these signals to select a follow-up section: Traffic and Reliability, Latency, Tokens and Cost, Cost and FinOps, Models and Usage or Trace Explorer.
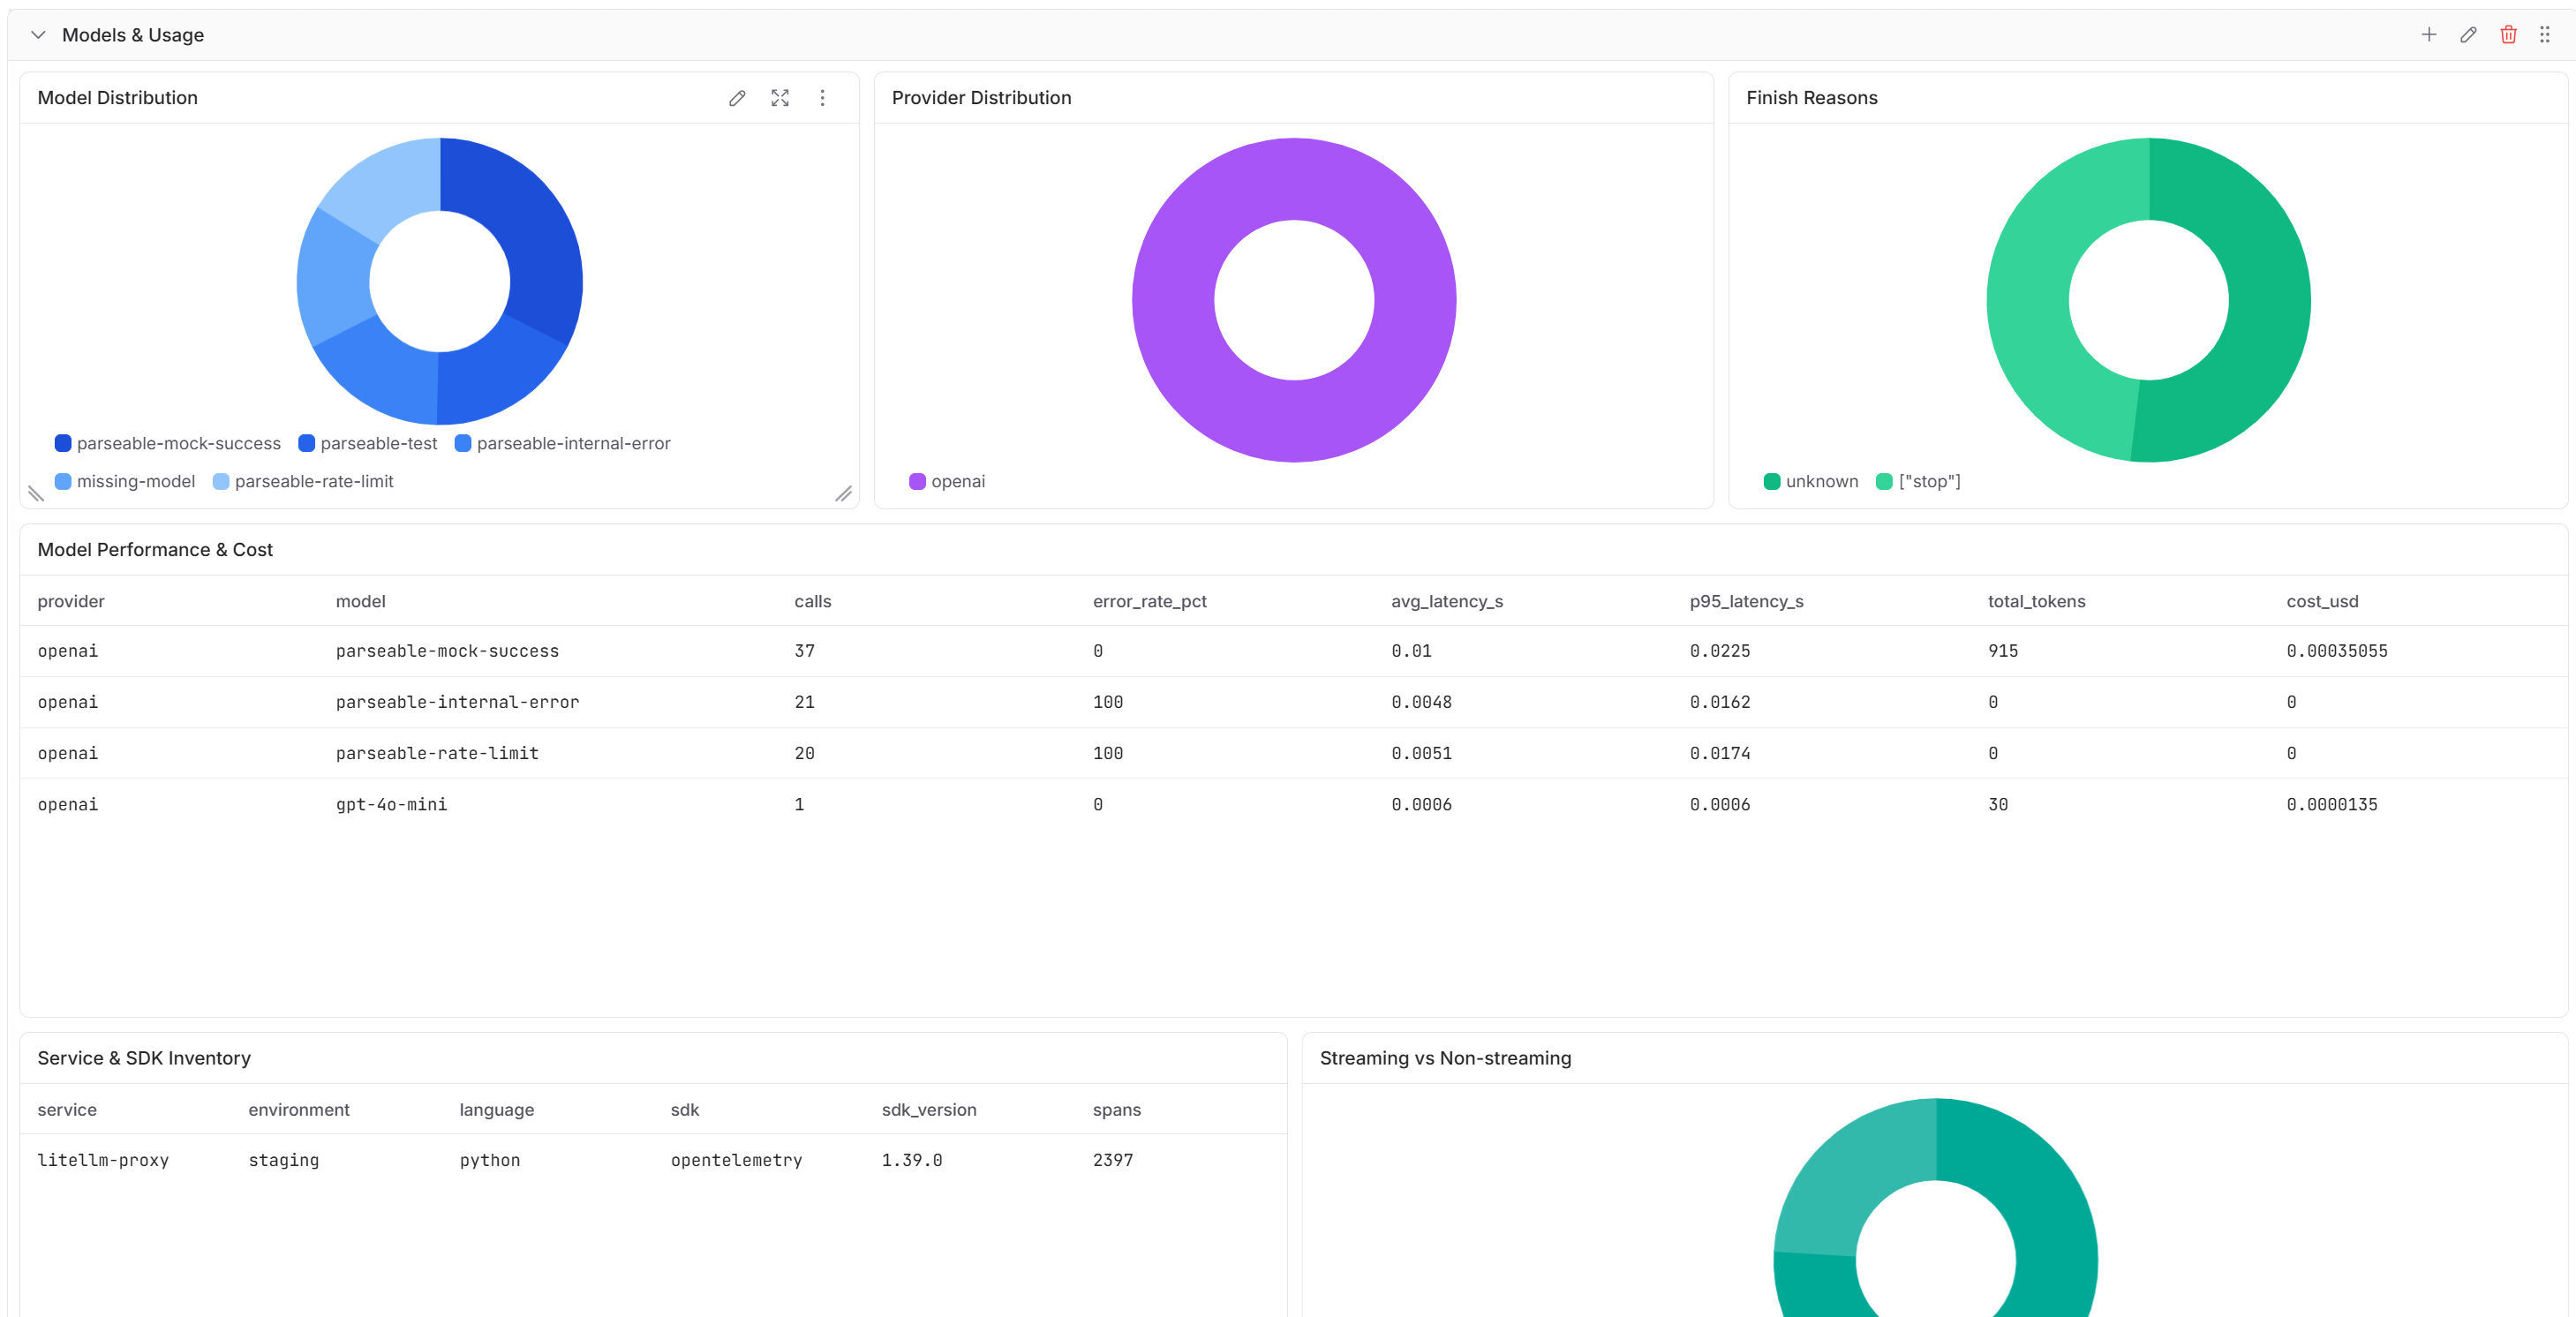
Models and usage
The Models and Usage section shows model and provider distribution, finish reasons, streaming usage and service inventory. Its Model Performance and Cost table compares call count, error rate, average and P95 latency, token volume and cost for each model.
Tokens and cost
The Tokens and Cost section shows input and output token totals, average cost per call, average tokens per call, token rate and spend rate by model. Its time-series panels compare token consumption and model cost over the selected period.
See Parseable Dashboards for import and customization instructions.