Grafana Cloud
Send LiteLLM traces and GenAI metrics to Grafana Cloud over OTLP
Prerequisites
- A Grafana Cloud stack
- An access policy token with the
traces:writeandmetrics:writescopes, from Connections > Add new connection > OpenTelemetry (OTLP) - Your stack's OTLP endpoint and numeric instance ID, shown on that same page
Setup
Grafana Cloud authenticates OTLP with HTTP Basic auth: the username is your instance ID, the password is the token. Build the credential once:
echo -n "<instance-id>:<access-policy-token>" | base64
Point LiteLLM at the gateway:
LITELLM_OTEL_V2=true
LITELLM_OTEL_INTEGRATION_ENABLE_METRICS=true

OTEL_EXPORTER="otlp_http"
OTEL_ENDPOINT="https://otlp-gateway-prod-us-west-0.grafana.net/otlp"
OTEL_HEADERS="Authorization=Basic%20<base64-from-above>"
litellm_settings:
  callbacks: ["otel"]

callback_settings:
  otel:
    attributes:
      include_list:
        - gen_ai.operation.name
        - gen_ai.system
        - gen_ai.request.model
        - gen_ai.framework
        - metadata.user_api_key_team_id
The include_list keeps metric attributes to a bounded set, which is what lets rate() and increase() aggregate cleanly and keeps your active series count low. Set it before sending production traffic. It applies to metrics only, so traces keep their full attribute set; see Control metric attribute cardinality for the denylist form
Start the proxy and send a request. Traces land in Tempo, metrics in the hosted Prometheus, both queryable from Explore
Basic%20 and not Basic OTEL_HEADERS follows the OTLP spec, which encodes values in W3C Baggage format, so a space is written %20. Grafana Cloud's setup screens hand you the value in exactly this form. A literal space works too
To send traces only, drop LITELLM_OTEL_INTEGRATION_ENABLE_METRICS
Traces
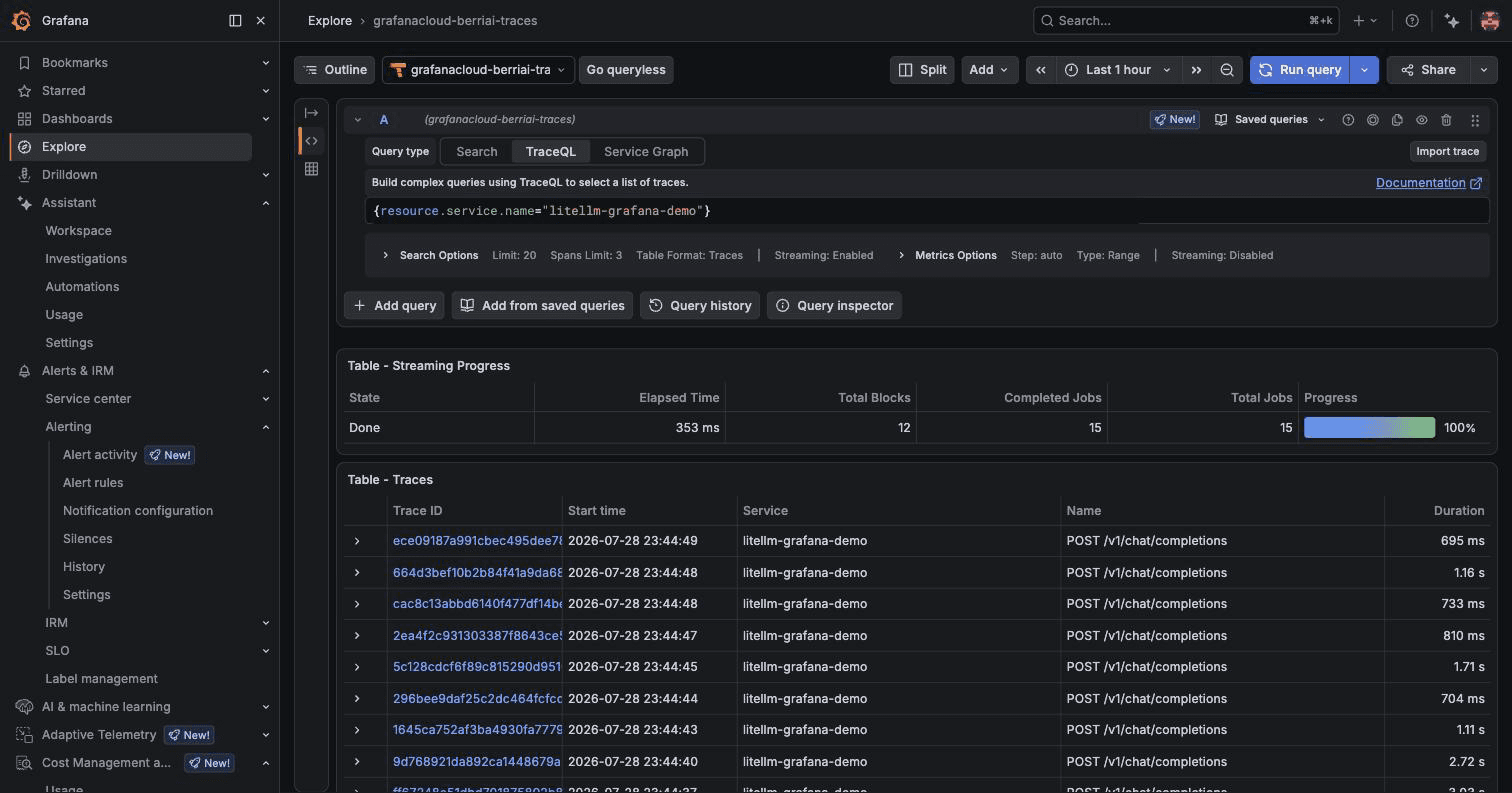
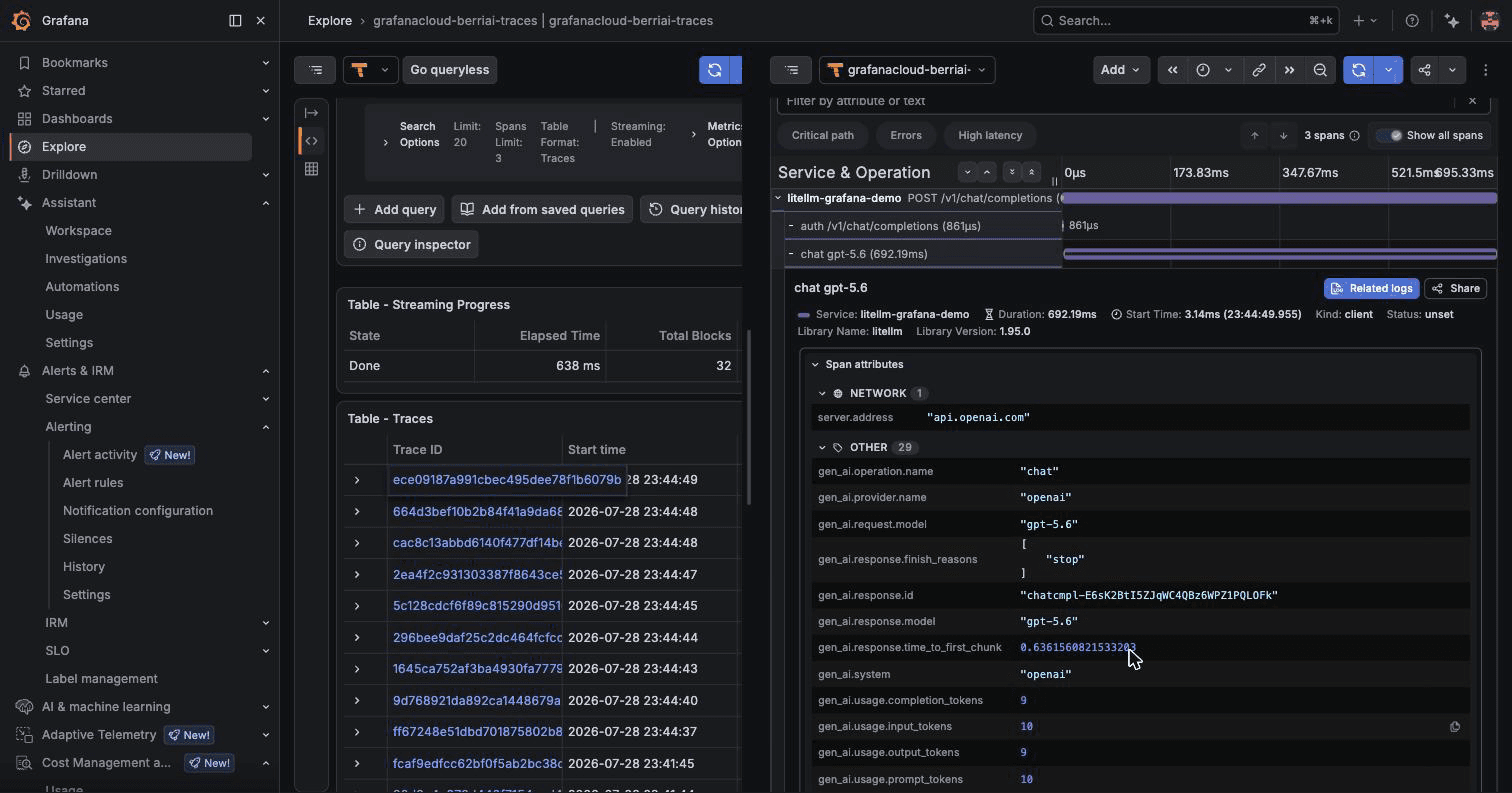
Each request is one trace: the server span for the route, an auth span, and a chat <model> span carrying canonical OpenTelemetry GenAI attributes for model, provider, token counts, and latency
Metrics
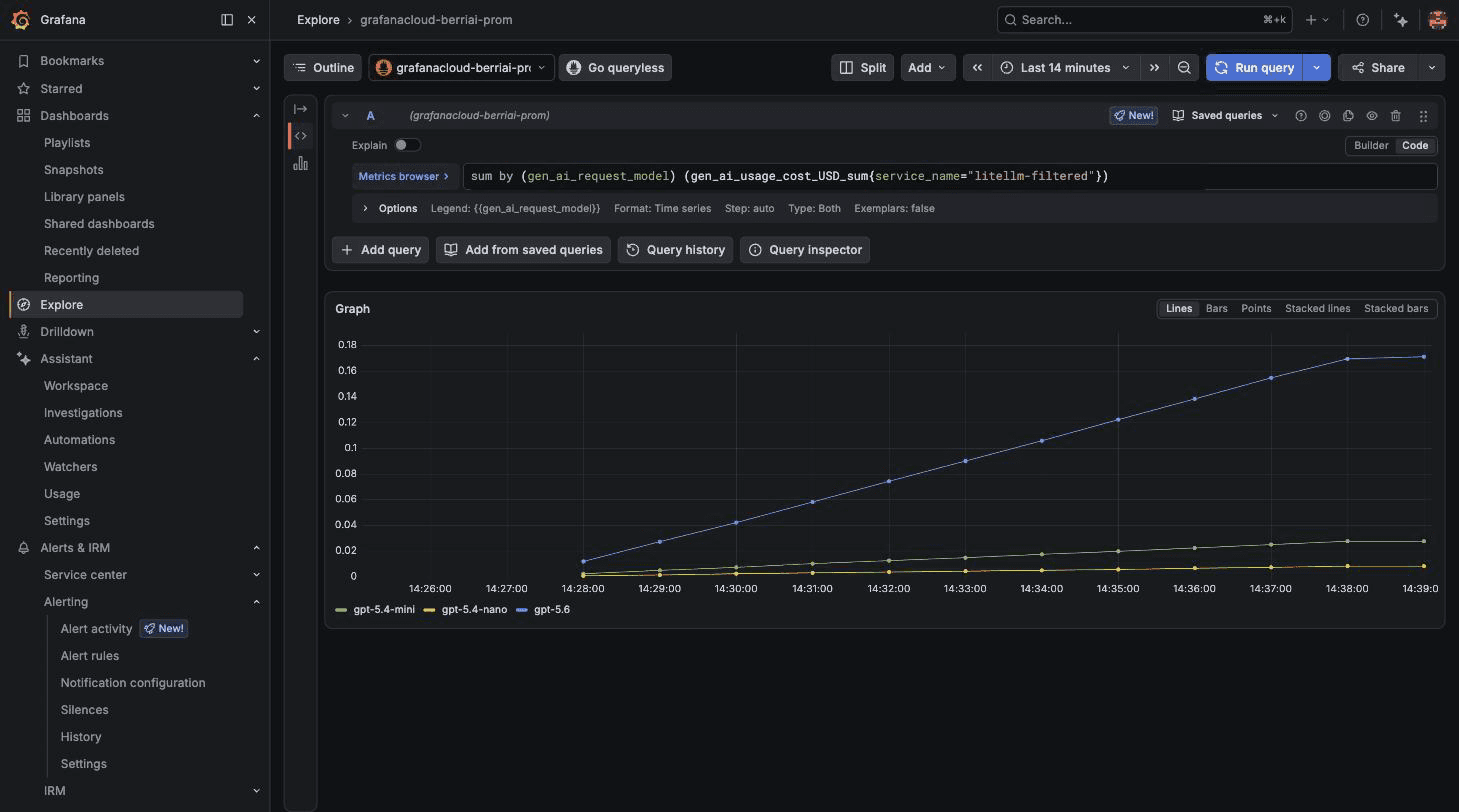
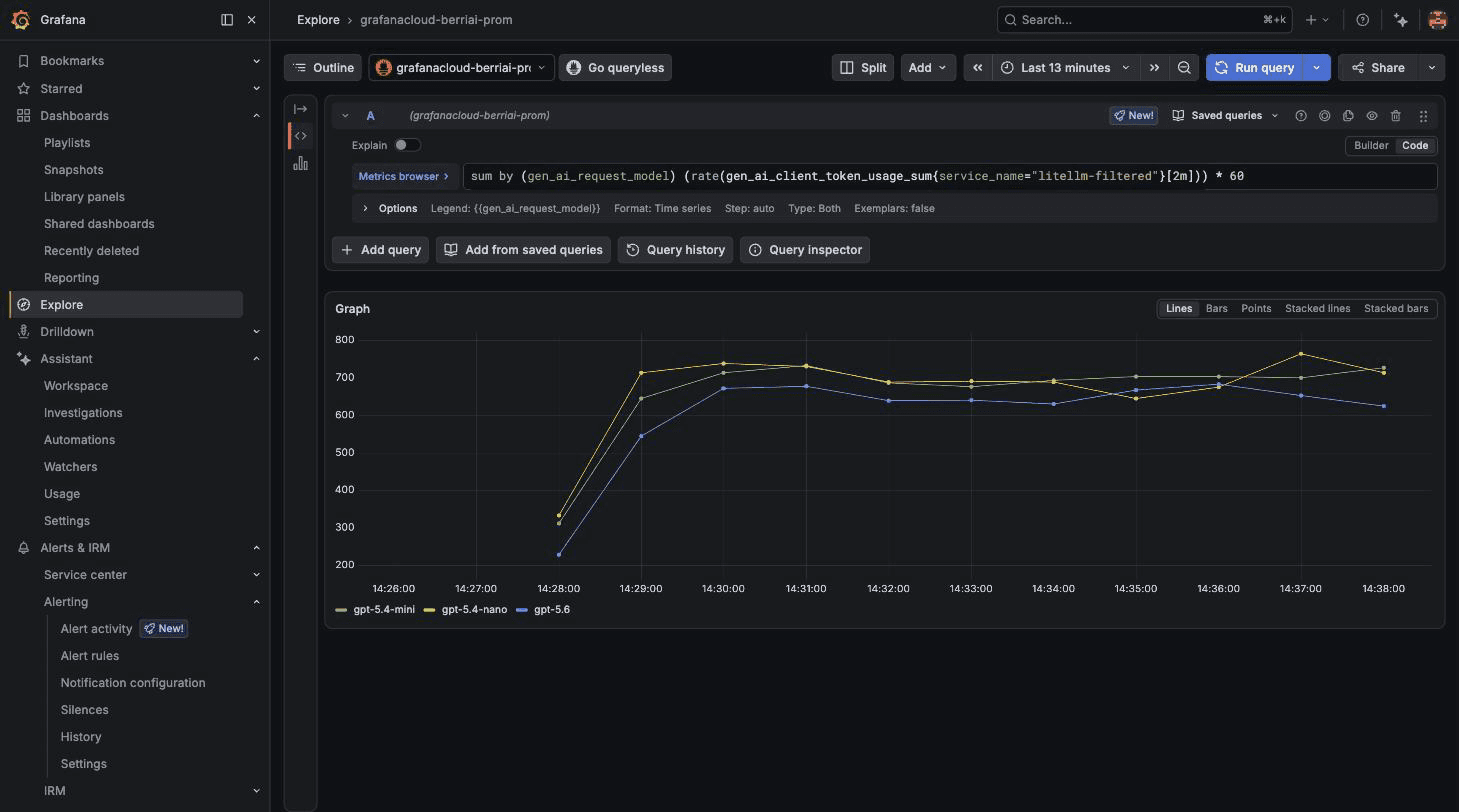
Metrics arrive as OTLP histograms, queryable in Explore under their Prometheus-normalized names:
| LiteLLM instrument | Queryable as |
|---|---|
gen_ai.client.operation.duration | gen_ai_client_operation_duration_seconds_bucket |
gen_ai.client.token.usage | gen_ai_client_token_usage_bucket |
gen_ai.usage.cost | gen_ai_usage_cost_USD_sum |
gen_ai.server.time_to_first_token | gen_ai_server_time_to_first_token_seconds_bucket |
gen_ai.server.time_per_output_token | gen_ai_server_time_per_output_token_seconds_bucket |
gen_ai.client.response.duration | gen_ai_client_response_duration_seconds_bucket |
Dashboard
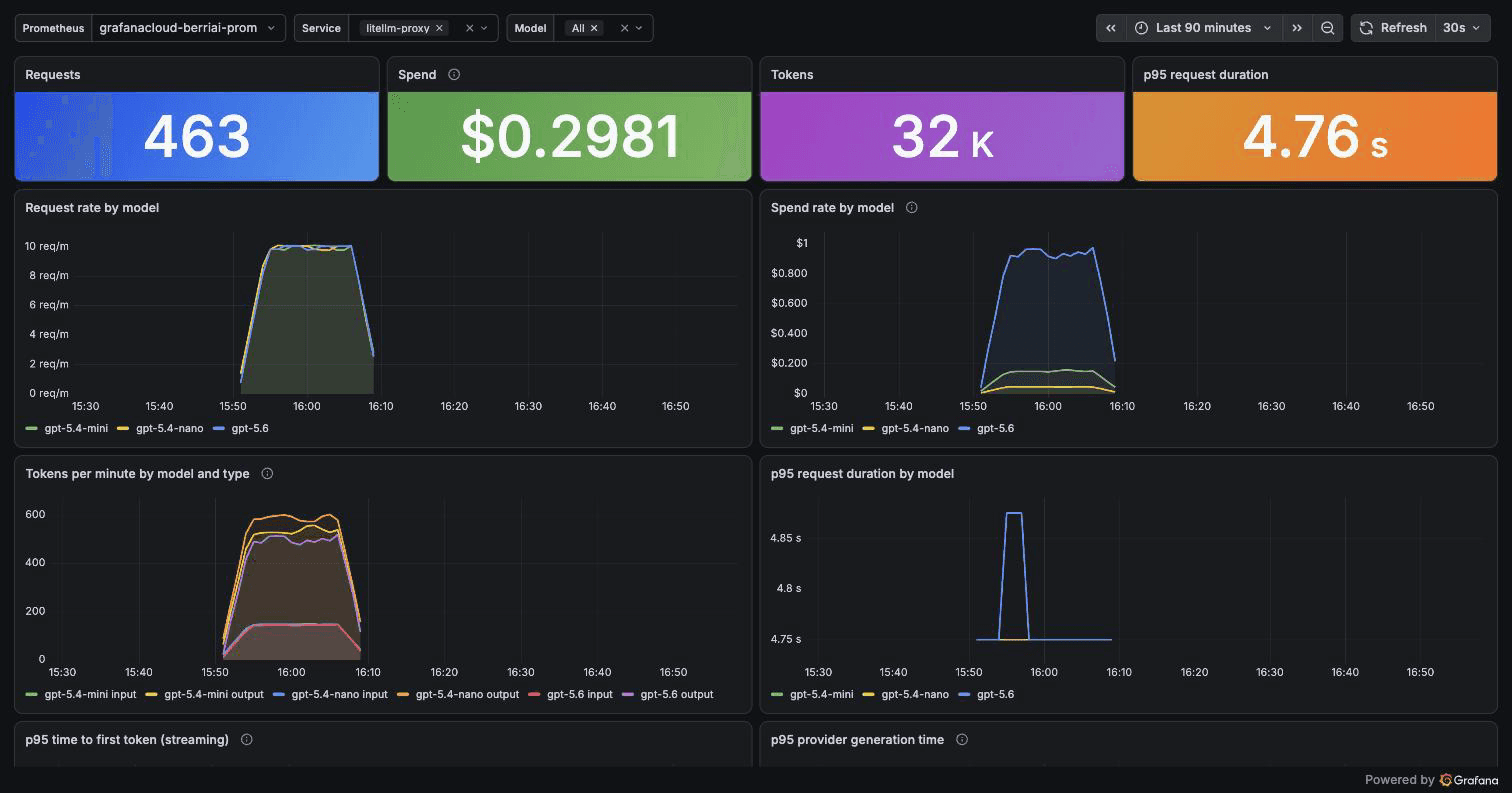
LiteLLM ships a dashboard for these metrics at cookbook/litellm_proxy_server/grafana_dashboard/dashboard_genai_otel. Import the JSON from Dashboards > New > Import and pick your Prometheus data source
Spend, tokens, request count and p95 duration as stats, then request rate, spend per hour, token throughput split by input and output, and p95 duration, time to first token, and provider generation time, all by model
Prometheus metrics
The OTLP path covers per-request GenAI telemetry. LiteLLM's operational metrics (budgets, rate limits, deployment health, spend) live on the proxy's /metrics endpoint and reach Grafana Cloud by scraping. Point Grafana Alloy at the proxy:
prometheus.scrape "litellm" {
  targets      = [{__address__ = "litellm-proxy:4000"}]
  bearer_token = "<litellm-api-key>"
  forward_to   = [prometheus.remote_write.grafana_cloud.receiver]
}

prometheus.remote_write "grafana_cloud" {
  endpoint {
    url = "https://prometheus-prod-<region>.grafana.net/api/prom/push"
    basic_auth {
      username = "<instance-id>"
      password = "<access-policy-token>"
    }
  }
}
/metrics requires a LiteLLM API key by default, which bearer_token supplies; set require_auth_for_metrics_endpoint: false under litellm_settings to expose it unauthenticated. Multi-worker deployments need PROMETHEUS_MULTIPROC_DIR set so workers report a combined view
Bound the label sets the same way you did for OTLP:
litellm_settings:
  prometheus_metrics_config:
    - group: "core"
      metrics:
        - "litellm_proxy_total_requests_metric"
        - "litellm_spend_metric"
      include_labels:
        - "model"
        - "team"
See Prometheus metrics for the full metric reference and the dashboards LiteLLM maintains for them